Published by everythingcryptoitclouds.com | August 21, 2025
Bitcoin stands at one of its most critical junctures in 2025, trading around $113,800 after a notable correction from its recent all-time high of $124,533. As the world’s leading cryptocurrency consolidates within a narrow range, traders and investors are asking the same pressing question: will Bitcoin break down from current levels or stage a powerful bounce toward new highs? The answer to this question could determine the trajectory of the entire cryptocurrency market for the remainder of 2025.
The current market structure presents a fascinating case study in technical analysis, institutional adoption, and market psychology. After reaching unprecedented heights earlier this month, Bitcoin has entered a consolidation phase that has left both bulls and bears positioning for what could be the next major directional move. With $150 billion in Bitcoin ETF assets providing institutional support and the 2024 halving continuing to constrain supply, the fundamental backdrop remains robust. However, technical indicators are painting a more nuanced picture that demands careful analysis.
The stakes couldn’t be higher. A successful bounce from current levels could propel Bitcoin toward the $120,000-$125,000 zone and potentially establish new all-time highs before year-end. Conversely, a breakdown below key support levels could trigger a more significant correction that tests the resolve of both institutional and retail investors. Understanding the technical, fundamental, and sentiment factors at play is crucial for anyone seeking to navigate this critical period in Bitcoin’s evolution.
The Technical Landscape: Mapping Bitcoin’s Critical Levels
Bitcoin’s current price action is defined by a series of well-established technical levels that have emerged through months of trading activity and institutional accumulation. The $113,000 zone where Bitcoin currently trades represents more than just a price level—it’s a battleground where the forces of supply and demand are engaged in a high-stakes contest that will determine the cryptocurrency’s near-term direction.
The most critical support level lies at $112,000, a threshold that has repeatedly attracted buying interest during recent corrections. This level has transformed from resistance to support following Bitcoin’s breakthrough earlier in the year, demonstrating the classic technical principle of role reversal. The strength of this support has been tested multiple times, with each successful defense reinforcing its significance in the minds of market participants. A sustained break below $112,000 would represent a significant technical failure that could trigger algorithmic selling and force leveraged positions to liquidate.
Below the immediate $112,000 support, a series of deeper support levels provide potential landing zones for any corrective move. The $110,000-$111,900 zone represents the next major support cluster, aligning with previous resistance levels and key Fibonacci retracement levels from Bitcoin’s recent advance. This area has historical significance as a accumulation zone where institutional buyers have previously stepped in during market weakness.
Should Bitcoin break below the $110,000 threshold, the next major support levels emerge at $107,400 and $105,200. These levels correspond to significant technical markers including the 200-day exponential moving average and major Fibonacci retracement levels. The psychological $100,000 level looms as the ultimate support test, representing not just a round number but a critical threshold that has captured the imagination of both institutional and retail investors.
On the upside, Bitcoin faces a series of resistance levels that could cap any rally attempt. The immediate resistance zone spans $114,000 to $115,000, representing the area where Bitcoin has struggled to maintain momentum during recent bounce attempts. This zone aligns with the 50-day simple moving average, which has been acting as dynamic resistance during the current consolidation phase.
The $117,500 level has emerged as a critical intermediate target for any bullish breakout. While not a direct Fibonacci extension, this level has shown significant importance in recent price action and represents a logical target for traders positioning for a bounce scenario. A successful break above $117,500 would likely trigger momentum-based buying and could accelerate Bitcoin’s advance toward higher targets.
The major resistance zone spans $120,000 to $123,000, encompassing the 0.768 Fibonacci extension of Bitcoin’s current bull cycle and representing the gateway to new all-time highs. This area has acted as a magnet for price action, with multiple attempts to break through resulting in rejection and subsequent consolidation. The volume and conviction required to break through this zone would likely signal the beginning of a new leg higher in Bitcoin’s bull market.
Institutional Dynamics: The New Market Structure
The landscape of Bitcoin trading has been fundamentally transformed by institutional adoption, creating a market structure that differs significantly from previous cycles. With over $150 billion in Bitcoin ETF assets and companies like MicroStrategy holding more than 629,000 BTC, institutional participation has introduced new dynamics that influence both support and resistance levels [1].
The presence of institutional investors has created what many analysts describe as a “floor” under Bitcoin prices, with large-scale accumulation occurring during any significant weakness. This institutional support has been evident during recent corrections, where buying interest has emerged consistently around key technical levels. The ETF structure allows traditional investors to gain Bitcoin exposure through familiar investment vehicles, creating a steady stream of demand that wasn’t present in previous market cycles.
However, institutional participation is a double-edged sword. While it provides support during corrections, it also introduces new sources of volatility when institutional flows reverse. Recent data shows moderate ETF outflows, reflecting some profit-taking by institutional investors following Bitcoin’s advance to all-time highs. These flows are closely monitored by market participants as they can provide early signals of changing institutional sentiment.
The derivatives market provides additional insight into institutional positioning and sentiment. Open interest in Bitcoin futures has been declining, indicating reduced speculative positioning and potentially setting the stage for a more sustainable move in either direction. The funding rate remains elevated and positive, confirming a bullish bias among leveraged traders, but this premium may actually hinder demand for new long positions as the cost of carrying leveraged exposure increases.
Wall Street’s involvement in Bitcoin has also introduced new trading patterns and volatility characteristics. The concentration of trading volume during New York market hours has become more pronounced, with significant price movements often coinciding with the opening and closing of traditional financial markets. This synchronization with traditional finance creates both opportunities and risks, as Bitcoin becomes more susceptible to broader market sentiment and macroeconomic developments.
The institutional adoption story extends beyond direct Bitcoin holdings to encompass the broader cryptocurrency ecosystem. The success of Bitcoin ETFs has paved the way for additional cryptocurrency investment products, creating a positive feedback loop that could drive further institutional adoption. However, this integration also means that Bitcoin is increasingly subject to the same regulatory and compliance considerations that govern traditional financial markets.
Market Sentiment and Psychology: Reading Between the Lines
Understanding market sentiment is crucial for predicting Bitcoin’s next move, as psychological factors often drive short-term price action even when fundamental and technical factors suggest a different direction. The current sentiment landscape presents a complex picture that reflects both the maturation of the cryptocurrency market and the ongoing tension between fear and greed that characterizes all financial markets.
The Fear and Greed Index, a widely followed sentiment indicator, currently shows a reading of “Fear,” representing a significant shift from the euphoric conditions that prevailed during Bitcoin’s advance to all-time highs. This shift in sentiment often precedes major market moves, as extreme readings in either direction tend to mark turning points in market psychology. The current fear reading suggests that negative sentiment may be reaching levels where contrarian investors begin to see value.
Social media sentiment and on-chain metrics provide additional insight into market psychology. The decline in social media mentions and engagement around Bitcoin suggests that retail interest has cooled following the recent correction. This reduction in retail participation often creates conditions for more sustainable price movements, as the absence of speculative excess allows fundamental factors to play a larger role in price discovery.
The behavior of long-term holders provides another window into market sentiment. On-chain analysis shows that long-term holders have been relatively stable during the recent correction, suggesting that the selling pressure has come primarily from shorter-term traders and speculators. This pattern is generally viewed as healthy for long-term price appreciation, as it represents a transfer of Bitcoin from weak hands to strong hands.
Institutional sentiment, while more difficult to measure directly, can be inferred from ETF flows and corporate treasury decisions. The recent moderate outflows from Bitcoin ETFs suggest some institutional profit-taking, but the scale of these outflows remains relatively modest compared to the overall institutional holdings. This pattern suggests that institutional investors are engaging in tactical rebalancing rather than wholesale abandonment of their Bitcoin positions.
The options market provides additional insight into sentiment and expectations. The put-call ratio and implied volatility levels suggest that investors are positioning for increased volatility in the near term, but the distribution of strikes indicates that most participants expect Bitcoin to remain within a relatively narrow range. This positioning could create conditions for a significant move in either direction if Bitcoin breaks out of its current consolidation range.
The Bullish Case: Factors Supporting a Bounce
The argument for a Bitcoin bounce from current levels rests on a combination of technical, fundamental, and structural factors that suggest the recent correction may represent a healthy consolidation rather than the beginning of a more significant decline. Understanding these bullish factors is essential for evaluating the probability of a successful bounce and the potential targets for any resulting rally.
From a technical perspective, Bitcoin’s ability to hold above the critical $112,000 support level demonstrates the underlying strength of the current bull market. This level has been tested multiple times during the recent consolidation, with each successful defense reinforcing its significance as a floor for Bitcoin prices. The fact that Bitcoin has not experienced a significant breakdown despite weeks of consolidation suggests that selling pressure is being absorbed by willing buyers at these levels.
The moving average structure remains supportive of higher prices, with the 50-day and 200-day moving averages both trending higher and providing dynamic support during any weakness. The 50-day simple moving average, currently around $113,500, has been acting as a key reference point for traders and could serve as a launching pad for any bounce attempt. A sustained close above this level would likely trigger momentum-based buying from technical traders and algorithmic systems.
Volume analysis provides additional support for the bullish case. Despite the recent correction, weekly trading volumes have increased by 34% to $48 billion, indicating renewed market engagement rather than capitulation. This increase in volume during a consolidation phase often precedes significant directional moves, as it suggests that market participants are actively positioning for the next leg of the trend.
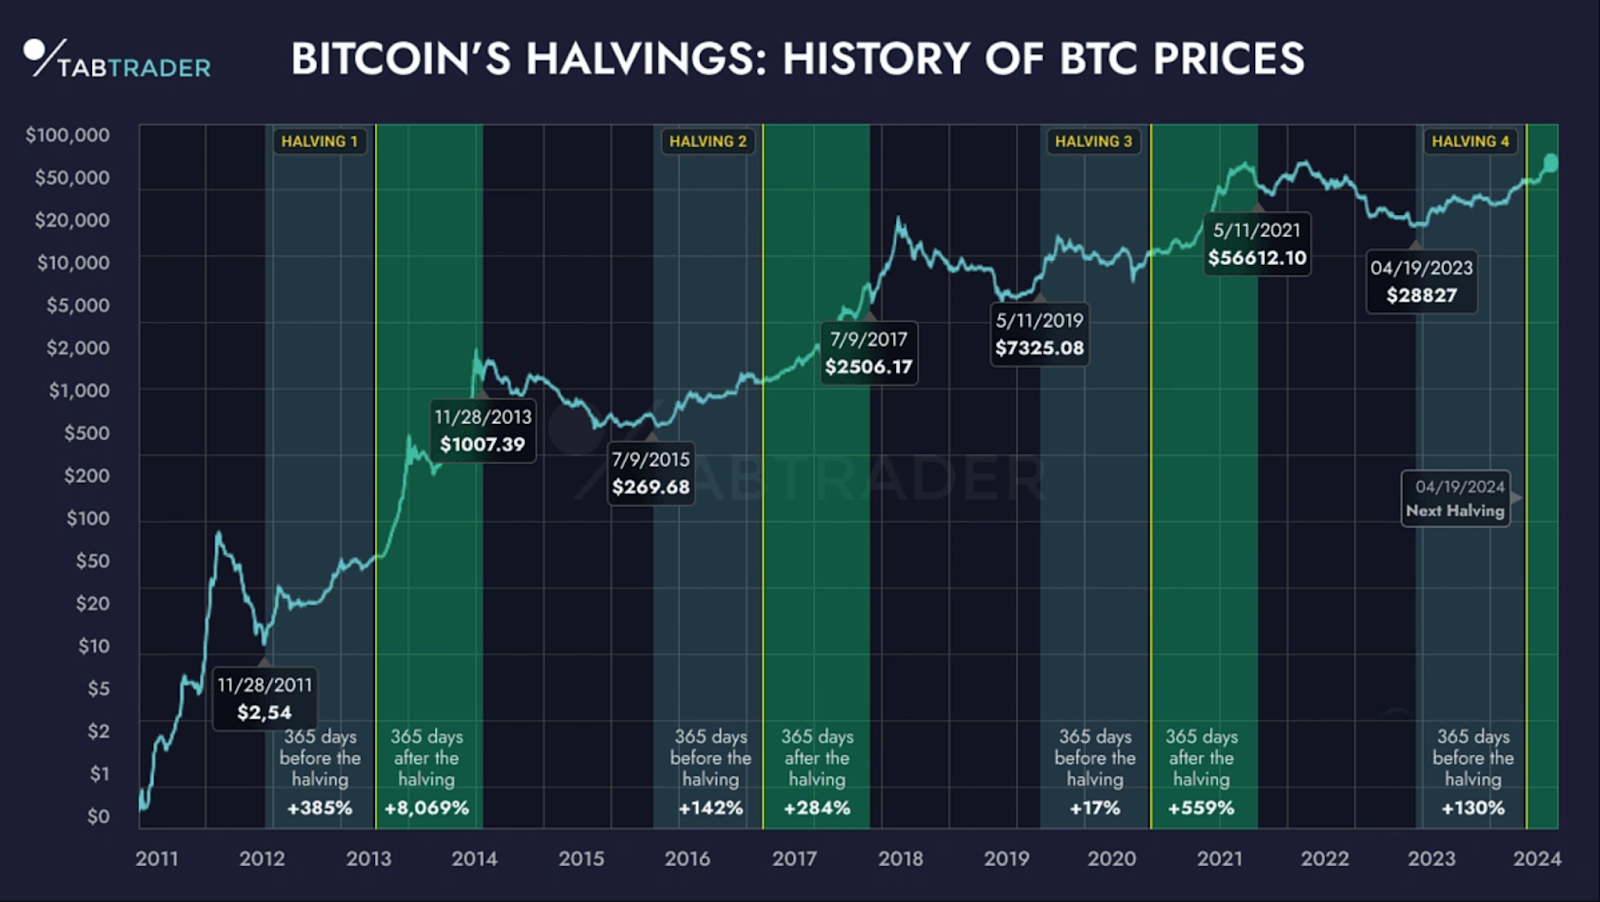
The fundamental backdrop for Bitcoin remains exceptionally strong, with the 2024 halving continuing to constrain new supply while institutional demand shows no signs of abating. The reduction in daily Bitcoin issuance to just 900 BTC has created a supply-demand imbalance that should theoretically support higher prices over time. This supply constraint becomes more significant as institutional adoption continues to grow and more Bitcoin is removed from active trading through long-term holding strategies.
Macroeconomic factors also support the bullish case for Bitcoin. The ongoing concerns about inflation, currency debasement, and geopolitical instability continue to drive interest in alternative stores of value. Bitcoin’s performance relative to traditional assets during periods of economic uncertainty has established its credentials as a hedge against systemic risks, attracting both institutional and retail investors seeking portfolio diversification.
The regulatory environment, while still evolving, has become increasingly favorable for Bitcoin adoption. The approval and success of Bitcoin ETFs has provided regulatory clarity and legitimacy that was previously lacking. This regulatory progress has opened the door for additional institutional participation and has reduced the regulatory overhang that previously weighed on Bitcoin prices.
Technical indicators also support the bullish case, with the Relative Strength Index (RSI) currently in the mid-60s, indicating room for further upside without reaching overbought conditions. The Average Directional Index (ADX) reading of 18.81 suggests weak directional momentum, but this often precedes sharp moves in either direction as market participants position for a breakout.
The Bearish Case: Warning Signs of a Breakdown
While the bullish case for Bitcoin presents compelling arguments, a thorough analysis must also consider the factors that could lead to a breakdown from current levels. Understanding these bearish risks is crucial for developing a balanced perspective on Bitcoin’s near-term prospects and for implementing appropriate risk management strategies.
The most immediate concern for Bitcoin bulls is the failure to reclaim and hold above key resistance levels despite multiple attempts. The repeated rejections at the $115,000-$117,500 zone suggest that selling pressure remains significant at these levels, potentially indicating that institutional or large-scale holders are using rallies as opportunities to reduce their positions. This distribution pattern, if confirmed, could lead to a more significant correction as the supply overhang weighs on prices.
Technical momentum indicators are showing signs of deterioration that could precede a breakdown. While the RSI remains in neutral territory, the failure to generate positive divergence during recent bounce attempts suggests that buying interest may be waning. The declining open interest in Bitcoin futures markets indicates reduced speculative positioning, which could limit the fuel available for a sustained rally.
The broader cryptocurrency market context also presents bearish risks for Bitcoin. The recent underperformance of altcoins relative to Bitcoin suggests that risk appetite in the cryptocurrency space may be diminishing. Historically, periods of altcoin weakness have often preceded broader cryptocurrency market corrections, as they indicate a flight to quality that eventually encompasses even Bitcoin.
Macroeconomic headwinds pose additional risks to Bitcoin’s near-term prospects. The Federal Reserve’s monetary policy outlook remains uncertain, with markets pricing in potential changes to interest rate policy that could affect risk asset valuations. Bitcoin’s correlation with traditional risk assets has increased during periods of market stress, making it vulnerable to broader market selloffs driven by macroeconomic concerns.
The institutional flow data presents a mixed picture that could turn more negative if current trends continue. While ETF outflows have been moderate, any acceleration in institutional selling could create significant downward pressure on Bitcoin prices. The concentration of Bitcoin holdings among a relatively small number of institutional players means that changes in their positioning can have outsized impacts on market dynamics.
Sentiment indicators, while not at extreme levels, show a clear deterioration from the euphoric conditions that prevailed during Bitcoin’s advance to all-time highs. The shift in the Fear and Greed Index to “Fear” territory suggests that market psychology is becoming more negative, potentially setting the stage for further selling if technical support levels fail.
The derivatives market structure also presents bearish risks. The high funding rates in perpetual futures markets indicate that leveraged long positions are paying a significant premium to maintain their exposure. This situation creates conditions for potential liquidation cascades if Bitcoin breaks below key support levels, as leveraged positions are forced to close and add to selling pressure.
On-chain metrics provide additional warning signs that could precede a breakdown. While long-term holders have remained relatively stable, there are signs of increased activity among shorter-term holders that could indicate preparation for selling. The exchange inflow data shows periodic spikes that suggest some holders are moving Bitcoin to exchanges in preparation for potential sales.
Critical Scenarios: Mapping the Paths Forward
Understanding the specific scenarios that could unfold from Bitcoin’s current position is essential for traders and investors seeking to position themselves for the next major move. The technical setup presents two primary scenarios, each with distinct triggers, targets, and implications for the broader cryptocurrency market.
The bullish scenario hinges on Bitcoin’s ability to reclaim and hold above the $113,500 level, which aligns with the 50-day simple moving average and represents a critical technical threshold. A sustained close above this level would likely trigger momentum-based buying from both technical traders and algorithmic systems, potentially accelerating Bitcoin’s advance toward higher targets. The initial target in this scenario would be the $117,500 level, representing approximately a 3-4% gain from current levels.
A successful break above $117,500 would open the door to a test of the major resistance zone between $120,000 and $123,000. This area encompasses the 0.768 Fibonacci extension of Bitcoin’s current bull cycle and represents the gateway to new all-time highs. A break above this zone could trigger a momentum-driven advance toward the $127,000-$132,000 area, representing potential gains of 15-17% from current levels.
The bullish scenario would likely be accompanied by increasing trading volumes and improving sentiment indicators. The Fear and Greed Index would likely shift back toward “Greed” territory, while social media engagement and retail interest would probably increase. Institutional flows would need to turn positive to support a sustained rally, with ETF inflows providing the fuel for higher prices.
The bearish scenario begins with a break below the critical $112,000 support level, which would represent a significant technical failure and likely trigger algorithmic selling. The initial target in this scenario would be the $110,000-$111,900 support zone, representing a 2-3% decline from current levels. However, the real risk in the bearish scenario lies in the potential for a cascade of selling that could drive Bitcoin toward much lower levels.
A break below $110,000 would likely accelerate the decline toward the $107,400 and $105,200 support levels, representing potential losses of 6-8% from current levels. The ultimate downside target in the bearish scenario would be the psychological $100,000 level, which could be reached if selling pressure intensifies and leveraged positions are forced to liquidate.
The bearish scenario would likely be characterized by increasing volatility and deteriorating sentiment indicators. The Fear and Greed Index would probably shift toward “Extreme Fear” territory, while institutional flows would turn negative as ETFs experience sustained outflows. The broader cryptocurrency market would likely follow Bitcoin lower, with altcoins experiencing even more significant declines.
Both scenarios have specific risk management implications that traders and investors must consider. In the bullish scenario, stop-loss levels should be placed below the $112,000 support to limit downside risk, while position sizing should account for Bitcoin’s inherent volatility. In the bearish scenario, any long positions should be protected with tight stops, while short-term traders might consider waiting for a clearer directional signal before establishing new positions.
Expert Analysis and Market Commentary
The current Bitcoin market structure has attracted significant attention from technical analysts, institutional strategists, and cryptocurrency experts, each offering unique perspectives on the potential outcomes of the current consolidation phase. Understanding these expert viewpoints provides valuable context for evaluating the competing scenarios and their relative probabilities.
Christopher Lewis, a veteran forex and cryptocurrency analyst with over 20 years of experience in financial markets, maintains a constructive view on Bitcoin’s near-term prospects. In his recent analysis, Lewis emphasized the importance of the $112,000 support level, noting that “Bitcoin bounced quite nicely during the trading session on Wednesday, as we have seen the $112,000 level reassert itself at an important level” [2]. His analysis suggests that as long as Bitcoin can maintain this support, the path of least resistance remains higher, with the $120,000 level serving as a “magnet for price.”
Lewis’s perspective is particularly noteworthy given his emphasis on the role of institutional participation in Bitcoin’s current market structure. He notes that “Wall Street is heavily involved in bitcoin now, so it will pay close attention to the volume coming out of New York.” This observation highlights the importance of monitoring institutional flows and trading patterns during New York market hours, as these have become increasingly influential in determining Bitcoin’s direction.
The technical analysis team at BlockByte, a prominent cryptocurrency research firm, has characterized the current setup as a “strategic breakout play” with well-defined risk-reward parameters. Their analysis identifies the $113,000 zone as a “pivotal battleground for bulls and bears,” with the potential for either a bullish breakout toward $117,500 or a bearish breakdown toward $100,000. This binary outlook reflects the compressed nature of Bitcoin’s current trading range and the potential for significant moves in either direction.
BlockByte’s analysis emphasizes the importance of risk management in the current environment, recommending strategic entry points in the $112,000-$113,000 range with stop-loss levels below $110,000. Their approach reflects the high-probability nature of the current setup while acknowledging the significant risks associated with Bitcoin’s volatility.
The technical analysis team at CoinTribune provides a more nuanced perspective that acknowledges both the underlying strength of Bitcoin’s long-term trend and the short-term challenges facing the cryptocurrency. Their analysis notes that “Bitcoin is trading in a consolidation phase, where the strength of the underlying trend contrasts with short-term fragilities.” This observation captures the tension between Bitcoin’s strong fundamental backdrop and the technical challenges it faces in the near term.
CoinTribune’s analysis places particular emphasis on the role of macroeconomic factors in determining Bitcoin’s next move. They note that “reactions to key technical thresholds and the macroeconomic climate will be decisive, especially as markets remain shaken by the notion that the Fed might not cut rates in September.” This perspective highlights the increasing correlation between Bitcoin and traditional financial markets, particularly during periods of macroeconomic uncertainty.
Institutional analysts have also weighed in on Bitcoin’s current situation, with many emphasizing the importance of ETF flows and corporate treasury decisions. The moderate outflows from Bitcoin ETFs in recent weeks have been interpreted by some analysts as healthy profit-taking rather than a fundamental shift in institutional sentiment. However, the sustainability of institutional demand remains a key factor that could determine Bitcoin’s ability to break out of its current range.
Risk Management and Strategic Considerations
Navigating Bitcoin’s current market environment requires a sophisticated approach to risk management that accounts for the cryptocurrency’s inherent volatility, the binary nature of the current setup, and the potential for significant moves in either direction. Developing an appropriate risk management framework is essential for both preserving capital and positioning for potential opportunities.
The first principle of risk management in the current environment is position sizing. Given Bitcoin’s volatility and the potential for significant moves in either direction, investors should limit their exposure to levels that allow them to withstand adverse price movements without compromising their overall portfolio objectives. A common rule of thumb suggests limiting cryptocurrency exposure to no more than 5-10% of a total investment portfolio, though this percentage may vary based on individual risk tolerance and investment objectives.
Stop-loss placement represents another critical component of risk management in the current environment. For investors maintaining long positions, stop-loss levels should be placed below the $110,000 support zone to limit downside risk while allowing for normal market volatility. This placement provides a buffer against false breakdowns while protecting against more significant losses if Bitcoin’s support structure fails.
The timing of entries and exits becomes particularly important in the current environment, where Bitcoin is trading within a relatively narrow range with well-defined support and resistance levels. Investors seeking to establish new long positions might consider waiting for a successful test and hold of the $112,000 support level, while those looking to reduce exposure might use rallies toward the $115,000-$117,500 resistance zone as opportunities to take profits.
Diversification within the cryptocurrency space also requires careful consideration in the current environment. While Bitcoin’s dominance has increased during the recent consolidation phase, the performance of altcoins and the broader cryptocurrency market could provide important signals about the sustainability of any Bitcoin rally. Investors should monitor the relative performance of major altcoins and cryptocurrency market indices as leading indicators of broader market sentiment.
The role of leverage in the current environment deserves special attention, as the potential for significant moves in either direction creates both opportunities and risks for leveraged positions. The high funding rates in perpetual futures markets indicate that leveraged long positions are expensive to maintain, while the potential for liquidation cascades creates additional risks for highly leveraged traders.
Hedging strategies may be appropriate for investors with significant Bitcoin exposure who want to maintain their long-term positions while protecting against near-term volatility. Options strategies, including protective puts or collar strategies, can provide downside protection while allowing for participation in any upside moves. However, the cost of options protection should be weighed against the potential benefits, particularly in a high-volatility environment.
Conclusion: Preparing for Bitcoin’s Next Chapter
As Bitcoin consolidates around the critical $113,000 level, the cryptocurrency market finds itself at a pivotal moment that could determine the trajectory of digital assets for the remainder of 2025. The technical setup presents a classic high-probability scenario with well-defined risk-reward parameters, clear support and resistance levels, and the potential for significant moves in either direction.
The bullish case for Bitcoin remains compelling, supported by strong institutional adoption, supply constraints from the 2024 halving, and a technical structure that suggests the recent correction may represent a healthy consolidation rather than the beginning of a more significant decline. The ability of Bitcoin to hold above the $112,000 support level despite weeks of consolidation demonstrates the underlying strength of the current bull market and suggests that selling pressure is being absorbed by willing buyers.
However, the bearish risks cannot be ignored, particularly given the repeated failures to break above key resistance levels and the deteriorating momentum indicators. The shift in market sentiment from euphoria to fear, combined with moderate institutional outflows and elevated funding rates, creates conditions where a breakdown below support could trigger a more significant correction.
The path forward for Bitcoin will likely be determined by its ability to navigate the critical technical levels that define the current trading range. A successful bounce from current levels that reclaims the $115,000-$117,500 resistance zone could open the door to new all-time highs and a continuation of the current bull market. Conversely, a breakdown below the $112,000 support level could trigger a correction toward the $100,000 psychological threshold and potentially delay Bitcoin’s advance to higher levels.
For investors and traders, the current environment demands a disciplined approach that emphasizes risk management, appropriate position sizing, and clear entry and exit strategies. The binary nature of the current setup creates both opportunities and risks that require careful navigation and a thorough understanding of the factors that could influence Bitcoin’s next move.
As we look ahead, the interplay between technical factors, institutional flows, and macroeconomic developments will likely determine whether Bitcoin breaks down or bounces from current levels. The outcome of this critical juncture will not only affect Bitcoin’s price trajectory but could also influence the broader cryptocurrency market and the pace of digital asset adoption.
The question of whether Bitcoin will experience a breakdown or bounce from current levels remains unanswered, but the framework for understanding the potential outcomes is clear. By monitoring the key technical levels, institutional flows, and sentiment indicators discussed in this analysis, market participants can position themselves to navigate whatever scenario ultimately unfolds.
Bitcoin’s journey to this critical juncture reflects the maturation of the cryptocurrency market and the increasing influence of institutional participants. As the market continues to evolve, the lessons learned from navigating this pivotal moment will likely inform investment strategies and risk management approaches for years to come.
References
[1] AInvest. “Bitcoin’s Critical Support and Resistance: A Strategic Breakout Play at $113K.” AInvest, August 21, 2025. https://www.ainvest.com/news/bitcoin-critical-support-resistance-strategic-breakout-play-113k-2508/
[2] Daily Forex. “BTC/USD Forecast: Support Holds at $112K.” Daily Forex, August 21, 2025. https://www.dailyforex.com/forex-technical-analysis/2025/08/btcusd-forecast-21-august-2025/232942
