The Fall of a Giant: Hyperunit Whale Suffers Brutal Ether Collapse

Author: everythingcryptoitclouds.com

Introduction: From Windfall to Wipeout

In the high-stakes world of cryptocurrency, fortunes can be made and lost in the blink of an eye. Few stories illustrate this brutal reality as vividly as that of the “Hyperunit whale,” a prominent trader who, in a dramatic turn of events, saw a $200 million windfall transform into a $250 million Ether (ETH) loss in early February 2026. This epic collapse, which left the whale with a mere $53 in their Hyperliquid account, serves as a cautionary tale about the perils of extreme leverage and the unforgiving nature of crypto markets.

This blog post delves into the rise and fall of the Hyperunit whale, examining the market dynamics that led to this brutal liquidation and the critical lessons for all crypto investors.

Digital Whale Concept

The Rise: A Master of Market Timing

The Hyperunit whale first gained notoriety in October 2025. At a time of heightened geopolitical tension, specifically around former President Trump’s tariff announcements, the whale made a strategic move: shorting over $1 billion in Bitcoin (BTC) and Ether (ETH). This prescient bet paid off handsomely, reportedly netting the trader a staggering $200 million windfall as the market reacted sharply to the news.

Linked to Garrett Jin, co-founder of WaveLabs/GroupFi, the whale’s identity became a subject of intense speculation. While Jin claimed the funds belonged to clients, the market was captivated by the apparent genius of a trader who could so accurately time a major market downturn.

The Fall: When Conviction Meets Catastrophe

Flush with success, the Hyperunit whale shifted strategy in mid-January 2026, taking a massive long position on Ethereum. Their total long exposure, encompassing ETH, Solana (SOL), and Bitcoin, exceeded $900 million, with a significant portion dedicated to Ether, valued at over $730 million.

However, the market had other plans. As February dawned, a confluence of macroeconomic headwinds and a broader crypto market downturn—dubbed “Black Sunday II”—sent Ether spiraling. The price of ETH broke below a critical support level of $2,620, accelerating its descent towards the $2,247-$2,400 range. This rapid depreciation triggered a cascade of liquidations across the market, and the Hyperunit whale’s highly leveraged position became unsustainable.

In a brutal 24-hour period, the whale was forced to exit their entire ETH long position on Hyperliquid, realizing an estimated $250 million loss. The once-mighty account was reduced to a mere $53, a stark symbol of how quickly fortunes can reverse in the crypto space.

Ethereum Crash Chart

The Aftermath: Lessons from the Abyss

The Hyperunit whale’s collapse sent shockwaves through the crypto community, contributing to a broader market liquidation event that saw over $2.5 billion wiped out. This incident offers several critical lessons for both seasoned and novice investors:

1. The Double-Edged Sword of Leverage

Leverage amplifies both gains and losses. While it allowed the Hyperunit whale to achieve a $200 million windfall, it also led to a $250 million loss. Even with a massive capital base, excessive leverage can lead to total ruin when the market moves against a position. The lesson is clear: use leverage sparingly and with extreme caution.

2. Market Timing is a Fickle Friend

The whale’s initial success in timing the October 2025 crash was remarkable. However, the subsequent failure to anticipate or react to the February 2026 downturn highlights that consistent market timing is incredibly difficult, if not impossible. Relying solely on timing, especially with high leverage, is a recipe for disaster.

3. Risk Management is Paramount

Even for a trader with deep pockets, proper risk management is non-negotiable. The absence of adequate stop-losses or a sufficient margin buffer meant that a relatively modest percentage drop in Ether’s price led to a complete liquidation. Diversification, conservative position sizing, and strict stop-loss orders are essential safeguards against such catastrophic losses.

4. The Unforgiving Nature of Decentralized Finance

Platforms like Hyperliquid, while offering unprecedented access to leveraged trading, operate with automated liquidation mechanisms. There are no bailouts or second chances when margin requirements are breached. This transparent and unforgiving system ensures market integrity but demands extreme discipline from its participants.

Hyperliquid Interface

Conclusion: A Cautionary Tale for All

The story of the Hyperunit whale is a powerful cautionary tale for anyone venturing into the volatile world of cryptocurrency. It underscores that even the most successful traders are not immune to the market’s brutal forces, especially when fueled by excessive leverage. While the allure of massive gains is undeniable, the potential for equally massive losses is ever-present.

For retail investors, the message is stark: learn from the mistakes of giants. Prioritize capital preservation, embrace conservative risk management, and never underestimate the market’s capacity for unexpected turns. In crypto, survival often means living to trade another day, even if it means missing out on some potential gains. The Hyperunit whale’s $53 balance is a sobering reminder of this fundamental truth.


References

[1] Cryptopolitan. Hyperunit whale’s $200M Trump-Tariff windfall turns into $250M Ether loss. [URL: https://www.cryptopolitan.com/hyperunit-whales-gain-turn-to-250m-loss/%5D
[2] Ainvest. ETH’s $2.6B Liquidation Wave: Flow-Driven Breakdown & Whale’s $250M Loss. [URL: https://www.ainvest.com/news/eth-2-6b-liquidation-wave-flow-driven-breakdown-whale-250m-loss-2602/%5D
[3] BingX. Hyperunit whale closes Ethereum long with $250M loss as ETH trades near $2,400. [URL: https://bingx.com/en/news/post/hyperunit-whale-closes-ethereum-long-with-m-loss-as-eth-trades-near%5D
[4] MEXC. Crypto Whale Suffers $250M Loss After Closing Massive Ethereum Long Position. [URL: https://www.mexc.com/en-GB/news/609282%5D
[5] CoinDesk. Single trader just lost $220 million as ether plunged 10%. [URL: https://www.coindesk.com/markets/2026/02/01/single-trader-just-lost-usd220-million-as-ether-plunged-10%5D
[6] Forklog. Hyperliquid Whale Loses $250 Million on Failed Ethereum Long, Leaving Just $53. [URL: https://forklog.com/en/hyperliquid-whale-loses-250-million-on-failed-ethereum-long-leaving-just-53/%5D

The Great Rotation: Why Retail Investors Are Dumping Bitcoin for Gold

Author: everythingcryptoitclouds.com

Introduction: The Shifting Sands of Safe Havens

For years, Bitcoin was hailed as “digital gold,” a decentralized hedge against inflation and economic uncertainty, poised to usurp its analog predecessor. Yet, as 2026 unfolds, a surprising narrative is emerging: retail investors are increasingly dumping their Bitcoin holdings in favor of traditional gold. This isn’t just a minor market fluctuation; it’s a significant rotation of capital, driven by a confluence of macroeconomic pressures, regulatory stagnation, and a renewed appreciation for gold’s enduring stability.

This shift challenges the very premise of Bitcoin as the ultimate safe haven and signals a potential recalibration of investor priorities in an increasingly volatile global landscape.

Gold vs Bitcoin Comparison

The Divergence: Gold Soars, Bitcoin Stumbles

The market data from late January and early February 2026 paints a clear picture of this divergence. Gold has been on an impressive run, surging past $5,400 per ounce and more than doubling its value over the past year. Analysts, including those at JPMorgan, are now projecting gold prices could reach $8,000-$8,500, fueled by a significant increase in household gold holdings.

Conversely, Bitcoin, after an optimistic start to the year that saw it briefly touch nearly $96,000, has stumbled. It slid below $84,000, marking its lowest point since November 2025. This stark contrast highlights a fundamental shift in investor sentiment.

Why the Great Rotation? Unpacking the Drivers

Several factors are contributing to retail investors’ renewed embrace of gold and their cooling enthusiasm for Bitcoin:

1. The Allure of Analog Stability in Turbulent Times

In an era marked by geopolitical tensions, aggressive political rhetoric (e.g., Trump’s policies), and persistent concerns about currency debasement, gold’s historical role as a tangible store of value is resonating deeply. Investors are seeking the proven stability of a physical asset, viewing it as a more reliable hedge against uncertainty than the more volatile digital alternative.

2. Regulatory Roadblocks and Fading “Trump Trade” Hype

Bitcoin’s narrative as a politically independent asset has been hampered by regulatory inertia. The much-anticipated “Clarity Act” for digital assets, intended to provide much-needed federal regulatory guidance, has stalled in the U.S. Senate. This regulatory uncertainty, coupled with a perceived lower priority for crypto from the current administration, has dampened the “Trump Trade” appeal that once buoyed Bitcoin.

3. Paper Losses and the Search for Real Returns

Many retail investors who entered the Bitcoin spot ETF market are now facing an average of 15% paper losses, with an implied entry price near $90,200. This experience of negative returns, especially when contrasted with gold’s consistent upward trajectory, is prompting a re-evaluation of risk and reward. The sentiment of “throwing in the towel” on Bitcoin is growing as investors seek more immediate and tangible gains.

4. Gold’s Liquidity Vacuum

According to some analysts, gold’s massive rally is creating a “liquidity vacuum” in the broader market. As capital flows overwhelmingly into gold, it’s effectively “sucking all the marginal liquidity” out of the system that might otherwise have flowed into cryptocurrencies. This dynamic makes it harder for Bitcoin to attract new investment and sustain upward momentum.

Gold Bars Chart

Comparative Performance: A Five-Year Perspective

While Bitcoin has had periods of explosive growth, the recent shift has solidified gold’s position. As of January 2026, gold has outperformed Bitcoin over a five-year period, a significant milestone that underscores its long-term resilience. Gold is currently in a state of “extreme greed” sentiment, reflecting strong investor appetite, while Bitcoin struggles to maintain key price levels.

Exchange-traded fund (ETF) flows further illustrate this trend: over $1.3 billion was pulled from Bitcoin-linked funds in a single week in late January, while gold and silver ETFs saw substantial inflows.

Conclusion: A Return to Tangible Value?

The great rotation from Bitcoin to gold in early 2026 is more than just a market trend; it’s a reflection of evolving investor psychology. In a world grappling with economic uncertainty and geopolitical instability, the tangible, time-tested value of gold is reasserting its dominance as the preferred safe haven asset. While Bitcoin continues to hold its promise as a revolutionary technology, its journey to becoming a universally accepted store of value is proving to be more complex and fraught with challenges than many once believed.

For retail investors, the message is clear: sometimes, the oldest solutions remain the most reliable.


References

[1] Investopedia. Gold Prices’ Rise Could Be Far From Over. Bitcoin, Meanwhile, Is Stumbling. [URL: https://www.investopedia.com/gold-prices-rise-could-be-far-from-over-bitcoin-meanwhile-is-stumbling-11895545%5D
[2] Bloomberg. Crypto Misses the Macro Trade as Retail Dives Into Gold Stocks. [URL: https://www.bloomberg.com/news/articles/2026-01-26/crypto-misses-the-macro-trade-as-retail-dives-into-gold-stocks%5D
[3] Coindesk. Gold in ‘extreme greed’ sentiment as it adds entire bitcoin market cap in one day. [URL: https://www.coindesk.com/markets/2026/01/29/gold-in-extreme-greed-sentiment-as-it-adds-the-entire-bitcoin-market-cap-in-one-day%5D
[4] Coindesk. Bitcoin ETF holders, sitting on paper losses, may throw in the towel. [URL: https://www.coindesk.com/markets/2026/02/02/bitcoin-etf-holders-sitting-on-paper-losses-may-throw-in-the-towel%5D
[5] Stocktwits. Why Crypto Is Crashing Has More To Do With Gold Than Binance Or ETFs: Raoul Pal. [URL: https://stocktwits.com/news-articles/markets/cryptocurrency/why-crypto-is-crashing-has-to-do-with-gold-than-binance-or-etfs-raoul-pal/cZbgWOHR4js%5D

The Interest-Bearing CBDC: China’s Digital Yuan Upgrade and the Global Race for Adoption

Author: everythingcryptoitclouds.com

Introduction: A Paradigm Shift in Central Bank Digital Currency

The global race to develop Central Bank Digital Currencies (CBDCs) has been defined by a fundamental debate: should the digital currency bear interest? Most central banks, including the U.S. Federal Reserve and the European Central Bank, have historically answered with a resounding “No,” fearing the risk of “digital bank runs” that could destabilize commercial banks. However, China’s central bank, the People’s Bank of China (PBOC), has just shattered this consensus.

Effective January 1, 2026, the PBOC will implement a new framework requiring commercial banks to pay interest on balances held in Digital Yuan (e-CNY) wallets [1]. This strategic pivot transforms the e-CNY into the world’s first interest-bearing CBDC, marking a significant escalation in China’s efforts to drive mass adoption and setting a new precedent for the future of digital money.

e-CNY Interest Concept

The Adoption Challenge and the Interest Solution

Despite being the most advanced CBDC project globally, the e-CNY has faced a crucial challenge: gaining widespread usage against the dominance of private payment giants like Alipay and WeChat Pay. The e-CNY was initially designed to be non-interest-bearing, a feature intended to prevent users from pulling large amounts of money out of commercial bank deposits and into the central bank’s digital currency, which would have severely impacted the commercial banking sector.

However, this non-interest-bearing status made the e-CNY an unattractive store of value compared to traditional bank deposits, which earn interest. The PBOC’s new policy directly addresses this by linking the e-CNY interest rate to prevailing demand deposit rates, making the digital currency a more competitive financial instrument [2].

Implications for Commercial Banks: Intermediaries Under Pressure

The PBOC’s two-tier system for the e-CNY relies on commercial banks as intermediaries for distribution and management. The new interest-bearing feature solidifies this role but also introduces a new dynamic of competition and cost.

Commercial banks have reportedly completed the necessary system upgrades to account for the digital yuan interest [3]. While this move forces banks to bear the cost of interest payments, it also ensures that the e-CNY is integrated directly into the existing financial ecosystem, rather than operating as a completely separate, disintermediating force.

The Global CBDC Race: A New Precedent

China’s decision to make its CBDC interest-bearing is a bold move that challenges the cautious approach taken by Western central banks.

  • The West’s Stance: The general consensus among central banks in the U.S. and Europe has been that a non-interest-bearing CBDC is necessary to protect the stability of the fractional reserve banking system.
  • China’s Strategy: By introducing interest, China is signaling that the benefits of mass adoption and increased usage—including greater monetary control and enhanced data visibility—outweigh the risks of disintermediation, or that they have developed sufficient tools to manage those risks.

This strategic shift places the e-CNY in direct competition with other global currencies and financial instruments, particularly in cross-border trade. An interest-bearing digital currency is inherently more appealing as a store of value, enhancing the e-CNY’s potential as a tool for internationalization [4].

CBDC Concept

Conclusion: The Future of Digital Money is Now

The introduction of interest payments on the Digital Yuan is a watershed moment in the evolution of CBDCs. It is a clear, aggressive strategy by the PBOC to overcome adoption hurdles and cement the e-CNY’s place in the daily lives of its citizens. By transforming the e-CNY from a mere payment token into a competitive financial asset, China is not only accelerating its own digital currency project but is also forcing other nations to re-evaluate their own CBDC designs. This development ensures that the e-CNY will remain a central topic in global finance and technology throughout 2026 and beyond.


References

[1] Bloomberg. China to Pay Interest on Digital Yuan in Bid to Boost Adoption. [URL: https://www.bloomberg.com/news/articles/2025-12-29/china-to-pay-interest-on-digital-yuan-in-bid-to-boost-adoption%5D

[2] Reuters. China’s digital yuan to become interest-bearing next year. [URL: https://www.reuters.com/world/asia-pacific/china-issue-digital-yuan-management-action-plan-2025-12-29/%5D

[3] Yicai Global. China to Require Banks to Pay Interest on Digital Yuan Wallets From 2026. [URL: https://www.yicaiglobal.com/news/china-to-require-banks-to-pay-interest-on-digital-yuan-wallets-from-2026%5D

[4] Ainvest. The Strategic Implications of China’s Interest-Bearing Digital Yuan. [URL: https://www.ainvest.com/news/strategic-implications-china-interest-bearing-digital-yuan-financial-institutions-cross-border-investors-2512/%5D

Zcash Explodes 27.75% as Arthur Hayes’ $10,000 Prediction Ignites Privacy Coin Renaissance

Zcash Surge Hero Image

The privacy-focused cryptocurrency Zcash has surged past $364, marking a dramatic 27.75% increase in just 24 hours as BitMEX co-founder Arthur Hayes’ bold $10,000 price prediction sends shockwaves through the cryptocurrency market.

The cryptocurrency landscape witnessed one of its most spectacular single-day rallies on October 27, 2025, as Zcash (ZEC) exploded past the $364 mark, delivering a staggering 27.75% gain that has catapulted the privacy-focused digital asset into the spotlight of institutional and retail investors alike [1]. This extraordinary surge, which has added over $1 billion to Zcash’s market capitalization and propelled it into the top 25 cryptocurrencies by market cap, represents far more than a typical crypto pump—it signals the beginning of what many analysts are calling the “Privacy Coin Renaissance” of 2025 [2].

The catalyst for this remarkable price action can be traced directly to a seemingly casual social media post by Arthur Hayes, the influential co-founder of BitMEX and one of cryptocurrency’s most respected thought leaders. Hayes’ description of Zcash as a “vibe check” accompanied by his audacious $10,000 price prediction has unleashed a wave of Fear of Missing Out (FOMO) that has swept through trading floors from Wall Street to retail investment apps, transforming what was once considered a niche privacy coin into one of the year’s most talked-about investment opportunities.

But this surge represents more than just speculative fervor. With Zcash’s highly anticipated halving event scheduled for November 18, 2025—just three weeks away—the convergence of Hayes’ endorsement, institutional validation through Grayscale’s $102 million fund launch, and the fundamental supply reduction mechanics of the upcoming halving has created what technical analysts are describing as a “perfect storm” for sustained upward price momentum.

The Arthur Hayes Effect: When Crypto’s Oracle Speaks, Markets Listen

Arthur Hayes has earned his reputation as one of cryptocurrency’s most prescient voices through a combination of technical acumen, market timing, and an uncanny ability to identify emerging trends before they become mainstream. His latest endorsement of Zcash, delivered through what he casually termed a “vibe check” on social media, has proven once again why his market calls carry such extraordinary weight in the digital asset ecosystem.

The immediate market response to Hayes’ Sunday evening post was nothing short of spectacular. Within hours of his $10,000 price prediction going live, Zcash experienced one of the most dramatic intraday rallies in its history, surging from $272 to a peak of $355 before stabilizing above the $364 level [1]. This represents not just a significant price movement, but a validation of Hayes’ continued influence in an increasingly crowded field of cryptocurrency analysts and influencers.

Hayes’ track record lends considerable credibility to his Zcash prediction. At the WebX 2025 conference in Tokyo, his bold forecast that Hyperliquid’s HYPE token could appreciate 126 times over three years triggered an immediate 4% price increase, demonstrating the market’s faith in his analytical capabilities [1]. His previous calls on Bitcoin’s trajectory during the 2020-2021 bull run, his early identification of the DeFi summer phenomenon, and his prescient warnings about the 2022 crypto winter have established him as one of the few voices in the space whose predictions consistently translate into market-moving events.

The psychology behind Hayes’ influence extends beyond mere technical analysis. As the co-founder of BitMEX, one of the world’s largest cryptocurrency derivatives exchanges, Hayes possesses an intimate understanding of market microstructure, institutional flow patterns, and the behavioral dynamics that drive cryptocurrency price discovery. His $10,000 Zcash target, while seemingly aggressive, is grounded in a sophisticated understanding of privacy coin fundamentals, regulatory tailwinds, and the growing institutional demand for financial privacy solutions.

What makes Hayes’ Zcash endorsement particularly significant is its timing. Coming at a moment when privacy coins have faced increasing regulatory scrutiny in some jurisdictions while simultaneously experiencing growing adoption in others, his public support signals a belief that the privacy coin sector is entering a new phase of mainstream acceptance. The fact that his prediction has already triggered such substantial institutional interest—evidenced by Grayscale’s rapid fund accumulation and the explosion in futures open interest—suggests that Hayes may once again be ahead of a major market trend.

Institutional Validation: Grayscale’s $102 Million Vote of Confidence

The institutional cryptocurrency landscape has undergone a dramatic transformation in 2025, with traditional financial institutions increasingly recognizing digital assets as legitimate investment vehicles. Against this backdrop, Grayscale’s launch of a dedicated Zcash fund that has already accumulated over $102 million in assets under management represents a watershed moment for privacy-focused cryptocurrencies [1].

Grayscale’s decision to create a Zcash investment vehicle, despite charging a substantial 2.50% management fee, demonstrates the asset manager’s confidence in both the long-term viability of privacy coins and the sophisticated demand from accredited investors seeking exposure to this specialized sector [1]. The rapid accumulation of assets—reaching nine figures in just weeks since the fund’s launch—indicates that institutional appetite for privacy-focused investments extends far beyond the speculative retail market.

This institutional validation carries implications that extend well beyond simple price appreciation. Grayscale’s involvement in the Zcash ecosystem significantly increases the probability of a future Exchange-Traded Fund (ETF) conversion, which would provide mainstream investors with regulated, accessible exposure to privacy coin investments [1]. The precedent set by Bitcoin and Ethereum ETF approvals suggests that regulatory acceptance of cryptocurrency investment products continues to evolve in a favorable direction, particularly for assets with strong institutional backing and clear use cases.

The derivatives market has responded to this institutional interest with remarkable enthusiasm. Zcash futures open interest has skyrocketed from less than $20 million before the Grayscale announcement to nearly $334 million as of October 27, 2025 [1]. This sixteen-fold increase in derivatives activity reflects not just speculative interest, but the establishment of sophisticated hedging and arbitrage strategies by institutional market participants who view Zcash as a legitimate asset class worthy of complex financial engineering.

Sunday’s futures trading volume of $713 million, while below the year’s peak of $3.25 billion, represents a substantial increase in institutional participation [1]. The fact that this volume was achieved on a weekend—traditionally a period of reduced institutional activity—suggests that the Zcash rally has captured the attention of global trading desks operating across multiple time zones.

The institutional embrace of Zcash also reflects a broader recognition of privacy as a fundamental requirement in the evolving digital economy. As central bank digital currencies (CBDCs) advance toward implementation and government surveillance capabilities expand, the demand for financial privacy solutions among both individual and institutional users has grown exponentially. Grayscale’s investment thesis likely recognizes this trend, positioning Zcash not just as a speculative investment, but as a hedge against the erosion of financial privacy in an increasingly monitored economic system.

Technical Analysis: Charting the Path to New All-Time Highs

Zcash Halving Countdown

From a technical analysis perspective, Zcash’s current price action represents a textbook example of a breakout from a prolonged accumulation phase into what Wyckoff Theory practitioners recognize as the markup phase—a period characterized by sustained institutional demand and systematic price appreciation [1]. The cryptocurrency’s movement above key resistance levels has established a bullish trend structure that technical analysts believe could carry ZEC toward new all-time highs in the coming weeks.

The immediate technical landscape presents a compelling picture for continued upward momentum. Zcash is currently challenging critical resistance at its all-time high of $372 and the R1 Pivot Point at $381 [1]. A decisive break above the $381 level would open the path toward the R2 Pivot Point at $436, representing approximately 20% upside potential from current levels. This target aligns closely with multiple technical indicators suggesting that the current rally has substantial room for continuation.

The Moving Average Convergence Divergence (MACD) indicator continues to display strongly bullish characteristics, with green histogram bars above the zero line growing progressively larger [1]. This pattern indicates that buying momentum is not only sustained but accelerating, suggesting that the current price movement represents genuine accumulation rather than speculative froth. The MACD’s behavior during this rally mirrors patterns observed during previous Zcash bull runs, providing historical context for the current price action.

However, technical analysis also reveals important cautionary signals that sophisticated traders are monitoring closely. The Relative Strength Index (RSI) has reached 73, well above the traditional overbought threshold of 70 [1]. While overbought conditions can persist during strong trending moves, this reading suggests that short-term consolidation or pullback may be necessary before the next leg higher can commence. The weekly RSI reading of 88 represents an extreme overbought condition that has historically preceded significant corrections in Zcash’s price history [1].

The primary Pivot Point support level at $303 represents a crucial technical floor for the current rally [1]. A healthy pullback to this level would represent approximately 17% downside from current prices and would provide an attractive entry opportunity for investors who missed the initial surge. Such a correction would also serve to reset overbought technical indicators while maintaining the overall bullish trend structure.

Zcash’s position relative to its key moving averages provides additional confirmation of the bullish trend. The cryptocurrency is currently trading well above both its 50-week and 100-week Exponential Moving Averages, indicating that the long-term trend structure remains intact [1]. This positioning is particularly significant given that previous Zcash bull runs have typically maintained this technical relationship throughout their duration.

The volume profile accompanying this price surge provides further validation of the move’s authenticity. Unlike pump-and-dump schemes characterized by unsustainable volume spikes, Zcash’s rally has been accompanied by steadily increasing participation across multiple timeframes and trading venues. This organic volume growth suggests that the price appreciation reflects genuine market demand rather than artificial manipulation.

The November 18 Halving: A Catalyst for Sustained Growth

The cryptocurrency community has long recognized halving events as among the most significant fundamental catalysts in digital asset markets. Zcash’s upcoming halving, scheduled for November 18, 2025—less than three weeks away—represents a critical inflection point that could sustain and amplify the current price rally well into 2026 [7].

The mechanics of Zcash’s halving are straightforward but profound in their implications. On November 18, the block reward paid to miners will be reduced from 3.125 ZEC to 1.5625 ZEC, effectively cutting the daily issuance of new Zcash tokens by 50% [7]. This supply shock, occurring at a time when demand is accelerating due to institutional adoption and Arthur Hayes’ endorsement, creates a fundamental imbalance that historically has driven significant price appreciation in halving-enabled cryptocurrencies.

Historical analysis of previous Zcash halvings provides compelling evidence for the bullish case. The cryptocurrency’s first halving in 2020 preceded a rally that saw ZEC appreciate from approximately $35 to over $300—a gain of more than 750% [7]. While past performance does not guarantee future results, the fundamental supply-demand dynamics that drove that rally remain intact and may be even more pronounced given the current institutional interest in privacy coins.

The timing of this halving is particularly fortuitous given the broader cryptocurrency market environment. Unlike previous halving events that occurred during bear markets or periods of regulatory uncertainty, the November 2025 halving is taking place during a period of increasing institutional adoption, regulatory clarity, and growing mainstream acceptance of cryptocurrency as an asset class. This favorable macro environment could amplify the traditional halving effect, potentially driving more sustained price appreciation than historical precedent might suggest.

Mining economics provide additional support for the bullish halving thesis. The 50% reduction in block rewards will immediately impact miner profitability, likely forcing less efficient operations to cease mining activities. This reduction in mining pressure, combined with Zcash’s difficulty adjustment algorithm, should result in improved economics for remaining miners while reducing the constant selling pressure that newly minted coins typically create in the market.

The psychological impact of the approaching halving cannot be understated. Cryptocurrency markets are driven as much by narrative and expectation as by fundamental analysis, and the halving represents one of the most powerful bullish narratives in the digital asset ecosystem. The fact that this halving is occurring just weeks after Arthur Hayes’ $10,000 prediction has created a confluence of bullish catalysts that could sustain buying pressure well beyond the halving date itself.

Smart money appears to be positioning ahead of the halving event. The dramatic increase in futures open interest and the rapid accumulation of assets in Grayscale’s Zcash fund suggest that sophisticated investors are building positions in anticipation of post-halving price appreciation. This pre-positioning could create additional upward pressure as the halving date approaches, potentially driving prices higher even before the supply reduction takes effect.

Privacy Coin Renaissance: Zcash Leading the Charge

Privacy Coins Renaissance

The broader cryptocurrency market in 2025 has witnessed a remarkable shift in investor sentiment toward privacy-focused digital assets, with Zcash emerging as the undisputed leader of what analysts are calling the “Privacy Coin Renaissance.” This sectoral rotation reflects growing awareness of financial privacy as a fundamental right and a practical necessity in an increasingly surveilled digital economy.

The catalyst for this privacy coin revival extends beyond simple speculative interest. As governments worldwide advance central bank digital currency (CBDC) initiatives that promise unprecedented visibility into individual financial transactions, demand for privacy-preserving alternatives has grown exponentially among both retail and institutional users. Zcash, with its sophisticated zero-knowledge proof technology and optional privacy features, has positioned itself as the premier solution for users seeking to maintain financial autonomy in the digital age.

Zcash’s technological advantages in the privacy coin sector are substantial and growing more relevant with each passing month. Unlike mixing services or privacy solutions that rely on obfuscation techniques, Zcash’s implementation of zk-SNARKs (Zero-Knowledge Succinct Non-Interactive Arguments of Knowledge) provides mathematically provable privacy that cannot be compromised through blockchain analysis or other surveillance techniques. This technological moat has become increasingly valuable as regulatory authorities and compliance departments seek privacy solutions that can satisfy both user demands and regulatory requirements.

The network’s on-chain metrics provide compelling evidence of growing adoption and utility. Shielded transactions—Zcash’s signature privacy feature—have reached multi-month highs, indicating that users are increasingly utilizing the network’s privacy capabilities rather than simply holding ZEC as a speculative investment [2]. This organic usage growth suggests that Zcash is transitioning from a purely speculative asset to a utility token with genuine real-world application.

Corporate and institutional adoption of privacy-preserving technologies has accelerated dramatically in 2025, driven by increasing awareness of data security risks and competitive intelligence concerns. Major corporations are beginning to recognize that financial privacy is not just a personal preference but a business necessity in competitive markets where transaction data can reveal strategic information to competitors, suppliers, and other stakeholders.

The regulatory environment for privacy coins has evolved more favorably than many observers expected. Rather than implementing blanket bans, most major jurisdictions have adopted nuanced approaches that distinguish between privacy tools used for legitimate purposes and those employed for illicit activities. This regulatory maturation has provided the clarity that institutional investors require to allocate capital to privacy-focused investments.

Zcash’s compliance-friendly approach has positioned it advantageously within this evolving regulatory landscape. The network’s transparent pool allows for full auditability when required, while the shielded pool provides privacy when desired. This dual-mode architecture enables users to satisfy regulatory requirements while maintaining privacy options—a balance that has proven attractive to institutional adopters who must navigate complex compliance frameworks.

The privacy coin sector’s performance in 2025 has been remarkable, with Zcash leading a broad-based rally that has seen privacy-focused cryptocurrencies outperform the broader market by substantial margins. This sectoral strength reflects not just speculative interest but fundamental recognition that privacy-preserving technologies represent a critical infrastructure component of the future digital economy.

Market Psychology and the FOMO Phenomenon

The psychological dynamics driving Zcash’s current rally extend far beyond traditional technical and fundamental analysis, encompassing complex behavioral patterns that have transformed rational market participants into momentum-driven buyers caught in the grip of Fear of Missing Out (FOMO). This psychological phenomenon, while often dismissed by traditional financial analysts, represents a powerful market force that can sustain price movements far beyond what fundamental analysis might suggest.

The FOMO effect surrounding Zcash has been particularly pronounced among sophisticated investors who typically pride themselves on disciplined, research-driven investment approaches. Clemente, a board member of treasury company K9Strategy, publicly acknowledged being “filled with so much FOMO” that he could not remain on the sidelines despite his usual cautious approach [1]. This admission from a professional investor highlights the psychological power of Hayes’ endorsement and the broader market dynamics at play.

The social media amplification of Zcash’s rally has created a feedback loop that continues to drive new participants into the market. Each price milestone achieved generates additional social media discussion, which in turn attracts new investors who fear missing out on further gains. This cycle has been particularly evident on cryptocurrency-focused platforms where discussions of Zcash’s performance have dominated trending topics and generated millions of impressions.

Professional traders have noted the unusual characteristics of the current FOMO cycle. Unlike previous privacy coin rallies that were driven primarily by retail speculation, the current Zcash surge has attracted significant institutional participation from the outset. This institutional involvement has provided a foundation of legitimacy that has encouraged additional retail participation, creating a broader and potentially more sustainable rally than previous privacy coin bull runs.

The psychological impact of Arthur Hayes’ $10,000 price target cannot be understated in driving FOMO behavior. Round numbers possess particular psychological significance in financial markets, and Hayes’ target represents a 27-fold increase from current levels—a gain that, while ambitious, falls within the realm of historical cryptocurrency performance during major bull runs. The specificity and boldness of this target have captured imaginations and provided a concrete goal around which bullish sentiment can coalesce.

Market microstructure analysis reveals the behavioral patterns typical of FOMO-driven rallies. Order book dynamics show consistent buying pressure across multiple price levels, with buyers willing to pay progressively higher prices rather than waiting for pullbacks. This behavior, while potentially unsustainable in the long term, can drive prices substantially higher in the short term as supply becomes increasingly scarce.

The international nature of cryptocurrency markets has amplified the FOMO effect by creating continuous buying pressure across global time zones. As Asian markets close and European markets open, fresh waves of buyers enter the market, sustaining momentum that might otherwise dissipate during traditional market hours. This 24/7 trading environment has proven particularly conducive to sustained FOMO-driven rallies.

Risk Assessment and Cautionary Considerations

While the bullish case for Zcash appears compelling across multiple analytical frameworks, sophisticated investors must carefully consider the substantial risks inherent in any investment that has appreciated 550% in just 30 days [1]. The extreme nature of this price movement, while potentially justified by fundamental developments, also introduces significant volatility and downside risk that could result in substantial losses for investors who enter at current levels.

The technical indicators present a mixed picture that demands careful interpretation. While the MACD and moving average relationships support continued bullish momentum, the RSI readings at both daily and weekly timeframes have reached extreme overbought levels that historically have preceded significant corrections [1]. The weekly RSI reading of 88 is particularly concerning, as this level has marked major tops in previous Zcash bull runs.

Regulatory risk remains a persistent concern for privacy coin investments despite the generally favorable regulatory evolution in 2025. Government attitudes toward financial privacy can shift rapidly in response to geopolitical events, security concerns, or changes in political leadership. Investors must consider the possibility that regulatory crackdowns on privacy coins could emerge with little warning, potentially devastating valuations regardless of underlying technological merit or adoption trends.

The concentration of buying interest around Arthur Hayes’ endorsement creates a single-point-of-failure risk that sophisticated investors must acknowledge. Should Hayes modify his bullish stance or express concerns about Zcash’s valuation, the resulting selling pressure could be severe given the extent to which current prices appear to reflect his influence. This key-person risk is amplified by the relatively thin trading volumes in privacy coin markets compared to major cryptocurrencies like Bitcoin and Ethereum.

Market liquidity concerns become particularly acute during periods of high volatility. While Zcash’s trading volumes have increased substantially during the current rally, the cryptocurrency’s market depth remains limited compared to larger digital assets. This liquidity constraint means that large sell orders could drive disproportionate price declines, creating additional risk for institutional investors or high-net-worth individuals holding substantial positions.

The halving event, while generally bullish for cryptocurrency prices, also introduces timing risks that investors must consider. Historical analysis shows that halving events can be “buy the rumor, sell the news” scenarios where prices appreciate in anticipation but decline once the actual event occurs. The fact that Zcash’s current rally has occurred so close to the November 18 halving date raises questions about whether the supply reduction benefits have already been priced into current valuations.

Competition within the privacy coin sector presents another risk factor that could impact Zcash’s long-term prospects. While ZEC currently leads the privacy coin renaissance, other projects with different technological approaches or regulatory strategies could emerge as preferred solutions for specific use cases. The cryptocurrency sector’s history of rapid technological evolution suggests that current market leaders cannot assume permanent dominance.

Macroeconomic factors could also impact Zcash’s trajectory regardless of privacy coin-specific developments. Changes in global liquidity conditions, interest rate policies, or risk appetite could drive capital flows away from speculative cryptocurrency investments toward traditional safe-haven assets. The correlation between cryptocurrency prices and broader risk assets has increased in recent years, making digital assets more susceptible to macroeconomic shocks.

Investment Implications and Strategic Considerations

For investors considering exposure to Zcash at current levels, the decision framework must balance the compelling fundamental and technical bullish case against the substantial risks inherent in any asset that has experienced such dramatic price appreciation. The investment implications extend beyond simple buy-or-sell decisions to encompass portfolio construction, risk management, and strategic timing considerations that could determine long-term investment success.

The case for Zcash investment rests on several pillars that appear likely to provide sustained support for higher valuations. The institutional validation provided by Grayscale’s $102 million fund launch demonstrates that sophisticated investors view privacy coins as a legitimate asset class worthy of significant capital allocation [1]. This institutional interest, combined with the approaching halving event and Arthur Hayes’ influential endorsement, creates a confluence of bullish catalysts that could drive continued price appreciation.

The technological moat that Zcash has established in the privacy coin sector provides a competitive advantage that could prove durable over time. As privacy concerns continue to grow among both individual and institutional users, Zcash’s proven zero-knowledge proof technology positions it advantageously to capture increasing market share in the privacy-preserving financial services sector. This technological leadership, combined with the network’s compliance-friendly architecture, suggests that ZEC could maintain its position as the preferred privacy coin for institutional adoption.

From a portfolio construction perspective, Zcash offers exposure to several investment themes that appear likely to drive returns in the coming years. The privacy coin thesis, the halving cycle dynamics, and the broader cryptocurrency adoption trend all support the inclusion of ZEC in diversified digital asset portfolios. However, the concentration risk associated with privacy coin investments suggests that position sizing should be carefully considered relative to overall portfolio risk tolerance.

The timing considerations for Zcash investment are particularly complex given the proximity of the November 18 halving event. Historical analysis suggests that halving-related price appreciation often begins months before the actual event and can continue for extended periods afterward. However, the fact that Zcash has already experienced substantial gains in anticipation of the halving raises questions about optimal entry timing for new investors.

Dollar-cost averaging strategies may be particularly appropriate for Zcash investment given the asset’s high volatility and the difficulty of timing optimal entry and exit points. This approach allows investors to build positions over time while reducing the impact of short-term price fluctuations on overall investment returns. The strategy is particularly relevant for investors who believe in the long-term privacy coin thesis but are concerned about current valuation levels.

Risk management considerations are paramount for any Zcash investment strategy. The use of stop-loss orders, position sizing limits, and profit-taking strategies can help investors participate in potential upside while limiting downside exposure. The extreme volatility that characterizes privacy coin markets makes these risk management tools essential for preserving capital during inevitable market corrections.

The international regulatory landscape for privacy coins continues to evolve, creating both opportunities and risks for investors. Jurisdictions that embrace privacy-preserving technologies may see increased adoption and investment flows, while those that implement restrictive policies could drive capital toward more favorable regulatory environments. Investors must monitor these regulatory developments closely and consider their potential impact on Zcash’s long-term prospects.

Future Outlook and Price Projections

Looking beyond the immediate excitement surrounding Arthur Hayes’ $10,000 price prediction and the approaching November halving, the long-term outlook for Zcash depends on several key factors that will determine whether the current rally represents the beginning of a sustained bull run or a speculative bubble destined for correction.

The most optimistic scenarios for Zcash’s future involve widespread adoption of privacy-preserving technologies across both retail and institutional markets. As governments worldwide implement increasingly sophisticated financial surveillance systems, demand for privacy coins could grow exponentially, driving Zcash toward or beyond Hayes’ ambitious $10,000 target. This scenario assumes continued technological leadership, favorable regulatory treatment, and successful execution of network upgrades that enhance both privacy and scalability.

More conservative projections focus on Zcash’s potential to capture a significant share of the growing cryptocurrency market while maintaining its position as the leading privacy coin. Under this scenario, ZEC could reasonably target the $1,000-$3,000 range over the next 12-24 months, representing substantial gains from current levels while remaining within historical cryptocurrency valuation frameworks. This projection assumes continued institutional adoption, successful navigation of regulatory challenges, and sustained interest in privacy-preserving technologies.

The technical analysis framework provides additional context for future price projections. The immediate targets of $420-$436 represent logical near-term objectives based on pivot point analysis and historical resistance levels [1][2]. Achievement of these targets would establish a foundation for further gains toward the $1,000 level, which represents a psychologically significant milestone that could attract additional institutional and retail investment.

The halving event scheduled for November 18 provides a fundamental catalyst that could drive price appreciation well into 2026. Historical analysis of cryptocurrency halving events suggests that the most significant price gains often occur 6-18 months after the actual supply reduction takes effect, as market dynamics adjust to the new supply-demand equilibrium. This timeline suggests that Zcash’s most substantial gains may still lie ahead, even after the current rally.

However, several risk factors could derail these optimistic projections. Regulatory crackdowns on privacy coins, technological challenges, increased competition, or broader cryptocurrency market corrections could all impact Zcash’s trajectory regardless of fundamental developments. The extreme nature of current valuations also suggests that any negative developments could result in severe price corrections that test investor resolve and confidence.

The institutional adoption trajectory will likely prove crucial in determining Zcash’s long-term success. If Grayscale’s fund continues to attract assets and additional institutional investment products emerge, the resulting legitimacy and accessibility could drive sustained demand growth. Conversely, if institutional interest wanes or regulatory concerns emerge, the lack of retail-driven demand could limit Zcash’s growth potential.

Global macroeconomic conditions will also influence Zcash’s future performance. Periods of economic uncertainty and currency debasement have historically driven interest in alternative monetary systems, potentially benefiting privacy coins like Zcash. However, economic stability and rising interest rates could reduce speculative demand for high-risk cryptocurrency investments.

The technological roadmap for Zcash includes several upgrades that could enhance the network’s capabilities and drive additional adoption. Improvements to transaction throughput, privacy features, and interoperability with other blockchain networks could expand Zcash’s addressable market and support higher valuations. The successful implementation of these upgrades will be crucial for maintaining technological leadership in the competitive privacy coin sector.

Conclusion: Navigating the Privacy Coin Revolution

Zcash’s extraordinary 27.75% surge following Arthur Hayes’ $10,000 price prediction represents far more than a typical cryptocurrency rally—it signals the emergence of privacy coins as a legitimate and increasingly essential component of the digital asset ecosystem. The confluence of institutional validation, approaching halving dynamics, and growing privacy awareness has created a perfect storm of bullish catalysts that could sustain Zcash’s momentum well beyond current levels.

The investment case for Zcash rests on solid fundamental foundations that extend beyond speculative enthusiasm. The cryptocurrency’s technological leadership in privacy-preserving technologies, combined with its compliance-friendly architecture and growing institutional adoption, positions it advantageously to capitalize on the increasing demand for financial privacy solutions. The approaching November 18 halving event provides an additional catalyst that could drive sustained price appreciation through 2026 and beyond.

However, investors must carefully balance these compelling opportunities against the substantial risks inherent in any asset that has experienced such dramatic price appreciation. The extreme overbought technical conditions, regulatory uncertainties, and concentration risks associated with privacy coin investments demand sophisticated risk management approaches and careful position sizing considerations.

For investors willing to navigate these challenges, Zcash offers exposure to several powerful investment themes that appear likely to drive returns in the coming years. The privacy coin revolution, institutional cryptocurrency adoption, and halving cycle dynamics all support the inclusion of ZEC in diversified digital asset portfolios, provided that investors maintain appropriate risk management disciplines and realistic expectations about volatility and potential drawdowns.

The ultimate success of Zcash’s current rally will depend on the cryptocurrency’s ability to transition from speculative momentum to sustainable adoption and utility. The early signs are encouraging, with institutional interest growing, network usage increasing, and regulatory clarity improving. However, the path forward will likely include significant volatility and periodic corrections that test investor resolve and confidence.

As the privacy coin renaissance continues to unfold, Zcash’s position as the sector leader provides both opportunities and responsibilities. The cryptocurrency’s ability to maintain technological leadership, navigate regulatory challenges, and deliver on the promises that have driven its current valuation will determine whether Arthur Hayes’ $10,000 prediction proves prescient or overly optimistic.

For now, Zcash stands at a critical juncture where fundamental developments, technical momentum, and market psychology have aligned to create one of 2025’s most compelling cryptocurrency investment opportunities. Whether this alignment proves sustainable will depend on the complex interplay of technological innovation, regulatory evolution, and market dynamics that will shape the future of privacy-preserving digital assets.

The privacy coin revolution is just beginning, and Zcash’s current rally may represent the opening chapter of a much larger story about financial privacy, technological innovation, and the evolution of money in the digital age. Investors who can successfully navigate the risks and opportunities ahead may find themselves well-positioned to benefit from one of the most significant trends in the cryptocurrency ecosystem.


References

[1] FX Leaders. “Zcash Surges Past $364 as Arthur Hayes’ $10K Prediction Ignites FOMO Rally.” October 27, 2025. https://www.fxleaders.com/news/2025/10/27/zcash-surges-past-364-as-arthur-hayes-10k-prediction-ignites-fomo-rally/

[2] AInvest. “ZCash Surges 20% in 24 Hours, Entering Top 25 Cryptocurrencies with Market Cap of Over $1 Billion.” October 27, 2025. https://www.ainvest.com/news/zcash-surges-20-24-hours-entering-top-25-cryptocurrencies-market-cap-1-billion-2510/

[3] Crypto News. “Zcash price jumps over 30% in a day as Arthur Hayes eyes $10k target.” October 27, 2025. https://crypto.news/zcash-price-jumps-over-30-in-a-day-as-arthur-hayes-eyes-10k-target/

[4] Coinpedia. “Arthur Hayes ZEC Coin Price Prediction Sends Zcash Soaring Past $350.” October 27, 2025. https://coinpedia.org/news/arthur-hayes-zec-coin-price-prediction-sends-zcash-soaring-past-350/

[5] Bitrue. “Arthur Hayes $10000 ZEC Prediction: A Realistic Analysis.” October 27, 2025. https://www.bitrue.com/blog/arthur-hayes-10000-zec-prediction-analysis

[6] CoinTribune. “Bitcoin starts a correction after its all-time high – Technical analysis of August 20, 2025.” August 20, 2025. https://www.cointribune.com/en/bitcoin-starts-a-correction-after-its-all-time-high-technical-analysis-of-august-20-2025/

[7] CoinMarketCap. “Zcash (ZEC) Price Prediction For 2025 & Beyond.” October 26, 2025. https://coinmarketcap.com/cmc-ai/zcash/price-prediction/

[8] Bitget News. “Zcash Halving to Take Place in November.” October 20, 2025. https://www.bitget.com/news/detail/12560605024109

[9] CoinDCX. “Zcash Price Prediction 2025–2030: Will ZEC Cross $350?” 2025. https://coindcx.com/blog/price-predictions/zcash-price/

[10] NiceHash. “Zcash halving countdown.” 2025. https://www.nicehash.com/countdown/zec-halving-2028-11-16-12-00

[11] YouTube. “Zcash’s Massive Surge: Arthur Hayes’ Prediction Sparks 30% Rally.” October 27, 2025. https://www.youtube.com/watch?v=BEapDprHHAw

The Ultimate Guide to Crypto Airdrops in 2026: How to Earn Free Tokens with Testnets and Airdrop Hunting

The cryptocurrency landscape is constantly evolving, and with the anticipated bull run of 2026, a new wave of opportunities is emerging for savvy crypto enthusiasts. Among the most exciting of these are crypto airdrops and testnet rewards, which offer a way to earn free tokens by participating in the growth of new blockchain projects. This guide will provide a comprehensive overview of airdrop hunting, testnet participation, and the strategies you need to maximize your earnings in 2026.

What are Crypto Airdrops and Testnets?

A crypto airdrop is a marketing strategy employed by new blockchain projects to distribute their native tokens to a wide audience. The goal is to bootstrap a community of users and generate awareness for the project. These tokens are often distributed for free to users who meet certain criteria, such as holding a specific cryptocurrency or interacting with the project’s platform.

Testnets, on the other hand, are experimental versions of a blockchain network where developers can test new features and applications without risking real assets. To incentivize participation and gather valuable feedback, projects often reward testnet users with airdrops of their native tokens once the main network (mainnet) launches. This creates a symbiotic relationship where users get to experiment with new technology risk-free and are rewarded for their contributions, while projects get to battle-test their systems before a full-scale launch.

Crypto Airdrop Guide

Why 2026 is the Year of the Airdrop Hunter

The crypto market is cyclical, and all signs point to 2025-2026 being a significant growth period. This extended cycle, driven by institutional investment and structural market changes, is fostering a fertile ground for new projects to launch. As competition for users and attention intensifies, more projects will turn to airdrops as a powerful tool for community building. For the diligent airdrop hunter, this translates into a target-rich environment with unprecedented opportunities to accumulate a diverse portfolio of new and promising tokens.

A Step-by-Step Guide to Participating in Testnets

Engaging with testnets is one of the most reliable ways to qualify for airdrops. Here’s a step-by-step guide to get you started:

Step 1: Find and Join a Testnet

  • Research: Start by exploring new and upcoming blockchain projects. Follow crypto news sites, influencers, and airdrop-specific platforms like Bankless Airdrop Hunter and DappRadar.
  • Join the Community: Most projects announce their testnets on their official social media channels, such as Discord or Telegram. Joining these communities is often a prerequisite for participation.
  • Wallet Setup: You will need a Web3 wallet like MetaMask. It is highly recommended to use a separate, dedicated wallet for airdrop hunting to protect your primary assets.

Step 2: Active Participation

  • Get Testnet Tokens: Once you’ve joined a testnet, you’ll need testnet tokens (which have no real-world value) to interact with the platform. These are usually available for free through a “faucet” provided by the project.
  • Test Everything: The goal is to use the platform as extensively as possible. This includes swapping tokens, providing liquidity, minting NFTs, and testing every available feature.
  • Provide Feedback: Actively report any bugs or user interface issues you encounter. This is a valuable contribution that projects often reward.

Step 3: Build Your On-Chain Reputation

  • Be Consistent: Daily participation is key. Projects often track user activity and reward the most consistent and engaged participants.
  • Engage Socially: Participate in community discussions, ask thoughtful questions, and help other users. This demonstrates your commitment to the project’s success.
  • Incentivized Quests: Many projects offer incentivized testnet quests that guide you through specific tasks. Completing these is a great way to ensure you meet the airdrop criteria.

Airdrop Parachute Coins

Airdrop Hunting Strategies for 2026

Beyond testnets, there are several other strategies to maximize your airdrop rewards:

| Strategy | Description |
| :— | :— |
| Interact with Protocols Without Tokens | Use established platforms that have not yet launched a native token. These are often prime candidates for future retroactive airdrops. |
| Stake on Emerging Blockchains | Staking tokens on new Layer 1 or Layer 2 blockchains can often make you eligible for airdrops from projects building on that ecosystem. |
| Specialize in a Niche | Focus on a specific category of projects, such as DePIN (Decentralized Physical Infrastructure), Layer 2s, or tap-to-earn applications. This allows you to develop expertise and identify promising opportunities early. |
| Use Multiple Wallets (Carefully) | While some hunters use multiple wallets to increase their allocation, be aware that projects are actively developing methods to detect and disqualify such “Sybil” attacks. |

Hot Airdrop Categories for 2026

  • Layer 1s (e.g., Monad): New base-layer blockchains that aim to improve upon existing technologies.
  • Layer 2s (e.g., Linea): Scalability solutions built on top of existing blockchains like Ethereum.
  • DePIN (e.g., Grass, Dawn): Projects that use token incentives to build real-world physical infrastructure networks.
  • Tap-to-Earn (e.g., Sidekick, Midas): Mobile applications that reward users for simple, gamified interactions.

Airdrop Hunting

A Word of Caution: Beware of Scams

As with any lucrative opportunity in the crypto space, airdrops are a magnet for scammers. Be vigilant and follow these safety tips:

  • Never Share Your Private Keys: No legitimate airdrop will ever ask for your private keys or seed phrase.
  • Verify Official Links: Always double-check that you are interacting with the project’s official website and social media channels.
  • Be Wary of Unsolicited DMs: Scammers often impersonate project team members and send direct messages with malicious links.
  • Don’t Pay for an Airdrop: Legitimate airdrops are free. If a project asks you to send funds to receive an airdrop, it is a scam.

Conclusion: The Future is Free (If You Work for It)

Crypto airdrops and testnet rewards offer a unique and exciting way to earn free tokens and become an early adopter of the next wave of blockchain innovation. While the potential rewards are significant, they require diligence, consistency, and a healthy dose of skepticism. By following the strategies outlined in this guide, you can position yourself to capitalize on the airdrop opportunities of 2026 and build a diverse and promising crypto portfolio from the ground up.

Disclaimer: This article is for informational purposes only and does not constitute financial advice. Always conduct your own research before participating in any airdrop or testnet program.

Mastering Market Psychology: The Ultimate Guide to Cryptocurrency Fear and Greed Index in 2025

Published by everythingcryptoitclouds.com | August 25, 2025

In the volatile world of cryptocurrency trading, emotions often drive market movements more than fundamental analysis or technical indicators. Fear can trigger massive sell-offs that create exceptional buying opportunities, while greed can fuel unsustainable rallies that end in spectacular crashes. Understanding and quantifying these psychological forces has become crucial for successful crypto investing, which is where the Cryptocurrency Fear and Greed Index emerges as an indispensable tool for modern traders and investors.

The Fear and Greed Index, currently reading 47 and sitting in neutral territory as of August 25, 2025, represents one of the most sophisticated attempts to measure market sentiment in the cryptocurrency space. This powerful indicator has evolved from a simple concept borrowed from traditional finance into a comprehensive analytical framework that processes multiple data streams to provide real-time insights into the collective psychology of crypto market participants.

What makes this index particularly fascinating is its ability to capture the emotional extremes that characterize cryptocurrency markets. Unlike traditional financial markets, where institutional participation and regulatory oversight tend to dampen emotional swings, crypto markets remain highly susceptible to sentiment-driven movements. The Fear and Greed Index serves as a psychological barometer, helping traders navigate these emotional currents and make more rational investment decisions.

Fear and Greed Index Gauge

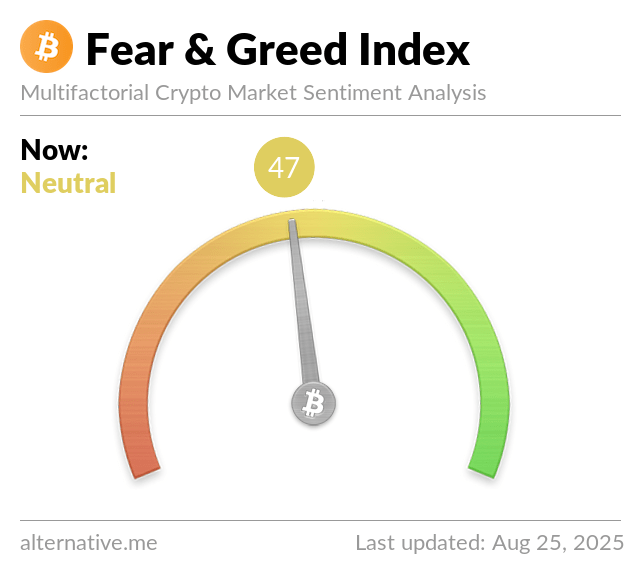
The current neutral reading of 47 comes after a significant shift from greed territory just days ago, when the index reached 60 following Bitcoin’s historic climb to $124,128. This dramatic swing from greed to neutrality in such a short timeframe perfectly illustrates the rapid emotional shifts that characterize cryptocurrency markets and demonstrates why understanding sentiment analysis has become essential for anyone serious about crypto investing.

The index operates on a scale from 0 to 100, where extreme fear (0-24) often signals oversold conditions and potential buying opportunities, while extreme greed (75-100) frequently indicates overbought markets ripe for correction. The neutral zone (25-74) represents periods of balanced sentiment, though these can quickly shift as market conditions evolve. Understanding these ranges and their implications forms the foundation of sentiment-based trading strategies that have proven remarkably effective in cryptocurrency markets.

The Science Behind Market Sentiment: Understanding the Fear and Greed Index

The Cryptocurrency Fear and Greed Index represents a sophisticated fusion of quantitative analysis and behavioral psychology, designed to capture the complex emotional dynamics that drive cryptocurrency markets. Unlike simple price-based indicators, this index synthesizes multiple data sources to create a comprehensive picture of market sentiment, providing insights that go far beyond what traditional technical analysis can offer.

The index draws its conceptual foundation from Warren Buffett’s famous investment philosophy: “Be fearful when others are greedy, and greedy when others are fearful.” This contrarian approach recognizes that markets often move in cycles driven by collective emotions, creating opportunities for those who can identify and act against prevailing sentiment. In cryptocurrency markets, where emotional extremes tend to be more pronounced than in traditional finance, this principle becomes even more powerful.

The mathematical framework underlying the index involves weighted aggregation of six distinct components, each capturing different aspects of market psychology. This multi-dimensional approach ensures that the index reflects genuine sentiment shifts rather than temporary fluctuations in any single metric. The weighting system has been carefully calibrated based on historical analysis of how different factors correlate with actual market turning points, creating a robust indicator that has demonstrated remarkable predictive value over multiple market cycles.

What sets the cryptocurrency version apart from its traditional finance counterpart is its focus on the unique characteristics of digital asset markets. The inclusion of social media sentiment analysis, for instance, reflects the outsized role that platforms like Twitter play in shaping crypto market narratives. Similarly, the emphasis on Bitcoin dominance acknowledges the unique dynamics of the crypto ecosystem, where Bitcoin often serves as a safe haven during periods of uncertainty.

The index updates every twelve hours, providing traders with timely insights into evolving market sentiment. This frequency strikes an optimal balance between responsiveness to genuine sentiment shifts and stability that prevents overreaction to temporary noise. The regular update schedule also allows traders to incorporate sentiment analysis into their daily decision-making processes, whether they’re managing long-term portfolios or executing short-term trading strategies.

The psychological foundation of the index rests on well-established principles of behavioral finance, particularly the concepts of loss aversion and herd mentality. During periods of extreme fear, loss aversion causes investors to overreact to negative news and sell assets at prices below their intrinsic value. Conversely, during periods of extreme greed, herd mentality drives investors to chase rising prices without adequate consideration of risk, creating unsustainable bubbles that eventually burst.

Deconstructing the Components: The Six Pillars of Sentiment Analysis

The Fear and Greed Index derives its analytical power from six carefully selected components, each weighted according to its historical correlation with market turning points and its reliability as a sentiment indicator. Understanding these components and their individual contributions provides crucial insights into what drives the overall index reading and how to interpret changes in market sentiment.

Volatility Analysis (25% Weight) forms the largest component of the index, reflecting the fundamental relationship between market uncertainty and price volatility. This component compares current Bitcoin volatility to its average levels over the previous 30 and 90 days, providing context for whether current market conditions represent normal fluctuations or unusual stress. Rising volatility typically indicates increased fear as investors become uncertain about future price direction, while declining volatility suggests growing confidence and a shift toward greed.

The volatility component captures more than just price movements; it reflects the underlying uncertainty that drives investor behavior. When markets experience high volatility, investors become more risk-averse, leading to selling pressure and further price declines. Conversely, periods of low volatility often coincide with growing investor confidence, creating conditions for sustained price appreciation. The 25% weighting reflects the strong historical correlation between volatility patterns and major market turning points.

Market Momentum and Volume (25% Weight) represents the second-largest component, analyzing buying and selling pressure through volume patterns. This component examines whether current trading volumes are unusually high or low compared to recent averages, providing insights into the intensity of market participation. High buying volumes during price increases typically indicate greed-driven behavior, as investors rush to participate in rising markets. Conversely, high selling volumes during price declines often reflect fear-driven capitulation.

The volume analysis goes beyond simple quantity measurements to examine the quality of market participation. Sustained high volumes during price advances suggest genuine buying interest rather than temporary speculation, while declining volumes during rallies may indicate weakening momentum. The component also considers the distribution of volume across different price levels, helping identify whether current market activity represents accumulation by long-term investors or distribution by those looking to exit positions.

Crypto Market Sentiment Analysis

Social Media Sentiment (15% Weight) captures the unique role that social platforms play in cryptocurrency markets, where news and opinions spread rapidly and can significantly impact prices. This component monitors hashtag interactions, engagement rates, and sentiment patterns across major social media platforms, particularly Twitter, where much of the crypto community’s discourse occurs. High engagement rates with positive sentiment typically indicate growing greed, while negative sentiment with high engagement often signals increasing fear.

The social media component employs sophisticated natural language processing algorithms to analyze not just the volume of mentions but also the emotional tone and context of discussions. This analysis helps distinguish between genuine sentiment shifts and artificial manipulation attempts, providing more reliable insights into authentic market psychology. The 15% weighting reflects the significant but not overwhelming influence of social media on actual trading behavior.

Direct Surveys (15% Weight) provide the most straightforward measurement of investor sentiment by directly asking market participants about their expectations and attitudes. These weekly surveys typically gather 2,000 to 3,000 responses from active crypto traders and investors, asking questions about market direction, risk appetite, and investment intentions. The survey component offers unique insights because it captures conscious investor attitudes rather than inferring sentiment from market behavior.

The survey methodology employs careful sampling techniques to ensure representative responses across different investor categories, from retail traders to institutional participants. Questions are designed to elicit honest responses about genuine investment intentions rather than wishful thinking or social desirability bias. The 15% weighting acknowledges that while surveys provide valuable direct insights, they may not always translate immediately into actual market behavior.

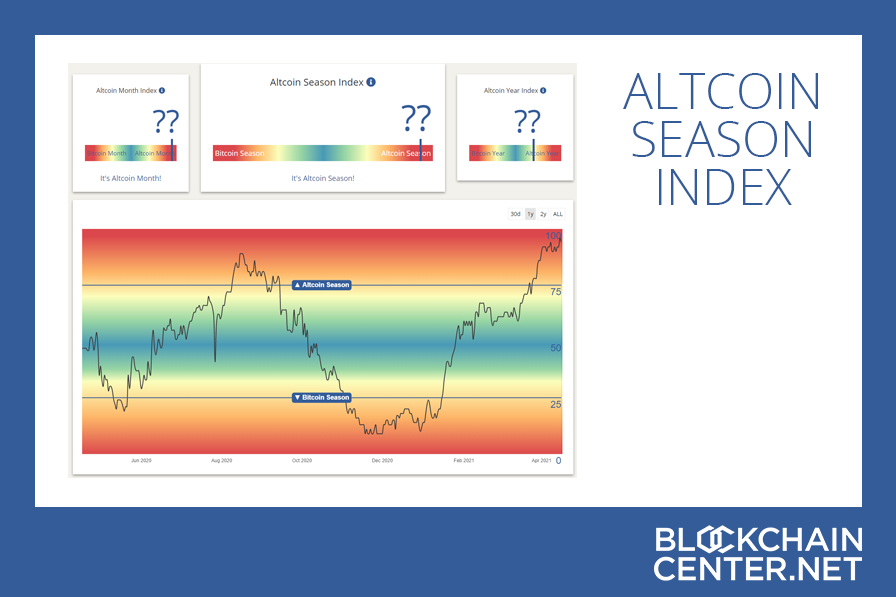
Bitcoin Dominance (10% Weight) reflects the unique dynamics of cryptocurrency markets, where Bitcoin often serves as a safe haven during periods of uncertainty. Rising Bitcoin dominance typically indicates fear-driven behavior, as investors retreat from riskier altcoins to the relative safety of Bitcoin. Declining dominance often signals greed-driven risk-taking, as investors venture into altcoins seeking higher returns.

The Bitcoin dominance component captures important portfolio allocation decisions that reflect broader risk appetite in the crypto ecosystem. During fear periods, investors tend to consolidate holdings in Bitcoin, viewing it as the most established and liquid cryptocurrency. During greed periods, investors diversify into altcoins, hoping to capture outsized returns from smaller, more volatile assets. The 10% weighting reflects the importance of this dynamic while acknowledging that dominance patterns can be influenced by factors beyond pure sentiment.

Google Trends Analysis (10% Weight) examines search patterns to understand public interest and concern about cryptocurrency markets. This component analyzes search queries related to Bitcoin and cryptocurrency, looking for patterns that indicate fear or greed. Searches for terms like “Bitcoin crash” or “crypto bubble” typically indicate fear, while searches for “how to buy Bitcoin” or “best cryptocurrency” suggest growing greed and interest.

The Google Trends component provides insights into broader public sentiment beyond active market participants, capturing the interest of potential new investors who may not yet be active in crypto markets. This forward-looking aspect makes it particularly valuable for identifying emerging trends before they fully manifest in market behavior. The search analysis also helps distinguish between different types of interest, separating genuine investment curiosity from crisis-driven information seeking.

Current Market Analysis: Navigating the Neutral Zone

The current Fear and Greed Index reading of 47, firmly planted in neutral territory, represents a fascinating inflection point in cryptocurrency market psychology. This reading comes after a dramatic journey from extreme greed territory just days ago, when the index reached 60 following Bitcoin’s historic ascent to $124,128. The rapid transition from greed to neutrality provides valuable insights into the current market dynamics and offers important clues about potential future direction.

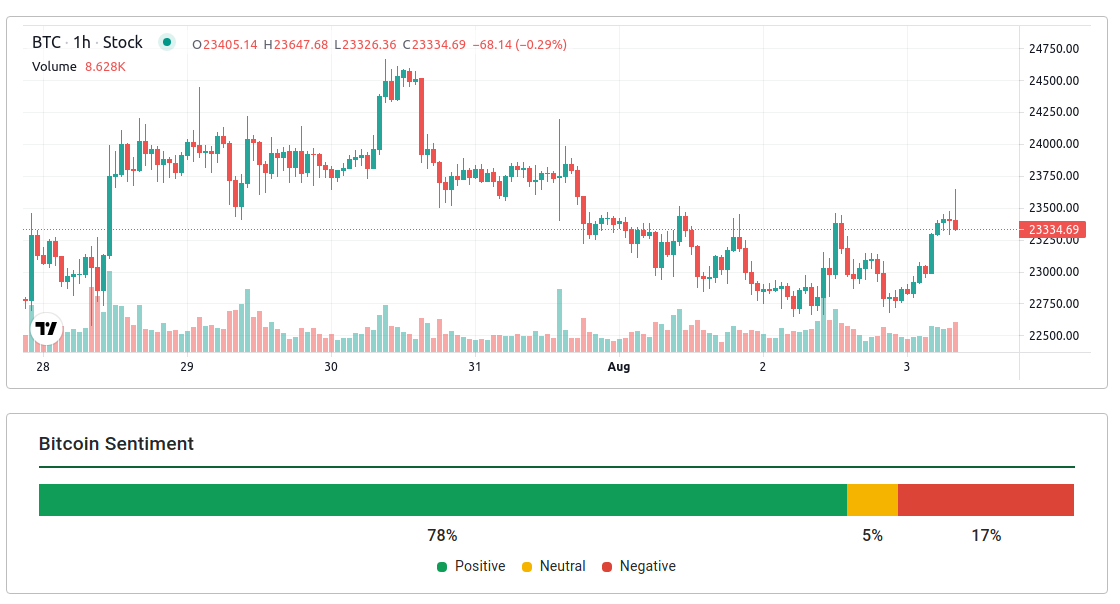
The shift from greed to neutral sentiment coincides with Bitcoin’s correction from its all-time high, dropping approximately 9% to current levels around $113,000. This price action, while significant in absolute terms, represents a relatively modest correction by cryptocurrency standards, yet it has been sufficient to cool the excessive optimism that characterized the market just days earlier. The speed of this sentiment shift illustrates the hair-trigger nature of crypto market psychology, where confidence can evaporate quickly when prices begin to decline.

Several factors have contributed to the current neutral reading, creating a complex web of influences that traders must navigate carefully. The anticipation surrounding Federal Reserve Chairman Jerome Powell’s remarks at the Jackson Hole Symposium has introduced macroeconomic uncertainty that extends beyond cryptocurrency markets. This broader economic context has tempered the pure crypto-focused optimism that drove the recent greed reading, as investors consider how monetary policy changes might affect risk asset valuations.

The neutral reading also reflects a market in transition, where neither fear nor greed dominates decision-making processes. This psychological state often precedes significant directional moves, as markets consolidate sentiment before breaking toward new extremes. Historical analysis suggests that extended periods in neutral territory are relatively rare in cryptocurrency markets, which tend to gravitate toward emotional extremes more quickly than traditional financial markets.

From a technical perspective, the neutral sentiment aligns with Bitcoin’s current price action, which has been characterized by consolidation around key support levels rather than panic selling or euphoric buying. This price behavior suggests that while the immediate greed-driven momentum has subsided, underlying demand remains sufficient to prevent a descent into fear territory. The market appears to be digesting recent gains while evaluating new information that could drive the next major move.

The composition of the current neutral reading provides additional insights into market dynamics. The volatility component has increased as Bitcoin’s price swings have become more pronounced, contributing to the decline from greed territory. However, volume patterns remain relatively healthy, suggesting that current price action represents normal profit-taking rather than panic selling. Social media sentiment has cooled from the euphoric levels seen during Bitcoin’s run to new highs, but remains generally positive rather than turning negative.

Bitcoin dominance patterns offer another perspective on current market psychology. The recent stability in Bitcoin’s market share relative to altcoins suggests that investors are neither fleeing to safety (which would increase dominance) nor aggressively risk-seeking (which would decrease dominance). This balanced approach to portfolio allocation aligns with the neutral sentiment reading and suggests that investors are taking a wait-and-see approach to current market conditions.

The survey component of the index reveals interesting nuances in investor attitudes. While overall sentiment has cooled from extreme optimism, most respondents continue to express cautious optimism about medium-term prospects. This suggests that the current neutral reading may reflect temporary uncertainty rather than a fundamental shift in long-term bullish sentiment. Investors appear to be pausing to reassess rather than abandoning their positive outlook entirely.

Google Trends data provides additional context for the current sentiment reading. Search patterns show continued interest in cryptocurrency topics, but with a shift from purely speculative queries toward more educational and analytical searches. This pattern suggests that while immediate FOMO (fear of missing out) has subsided, underlying interest in cryptocurrency remains strong, potentially providing a foundation for future sentiment improvements.

Trading Strategies: Harnessing Sentiment for Profit

The Fear and Greed Index offers multiple strategic approaches for cryptocurrency traders and investors, each tailored to different risk tolerances, time horizons, and market philosophies. Understanding how to effectively incorporate sentiment analysis into trading decisions can significantly enhance returns while helping manage risk during volatile market conditions.

The Contrarian Approach represents the most fundamental application of Fear and Greed Index analysis, based on the principle that extreme sentiment readings often coincide with market turning points. This strategy involves buying when the index shows extreme fear (0-25) and selling when it indicates extreme greed (75-100). The contrarian approach recognizes that markets tend to overshoot in both directions, creating opportunities for those willing to act against prevailing sentiment.

Implementing contrarian strategies requires significant psychological discipline, as it involves buying when negative news dominates headlines and selling when optimism reaches fever pitch. Historical analysis shows that some of the most profitable cryptocurrency investments have been made during periods of extreme fear, when quality assets trade at significant discounts to their intrinsic value. Similarly, taking profits during extreme greed periods has helped investors avoid major drawdowns during subsequent corrections.

The contrarian approach works particularly well in cryptocurrency markets because of their tendency toward emotional extremes. Unlike traditional financial markets, where institutional participation and regulatory oversight moderate sentiment swings, crypto markets can experience rapid shifts from euphoria to despair. These extreme movements create more pronounced opportunities for contrarian investors willing to act against crowd psychology.

Successful contrarian trading requires careful position sizing and risk management. Rather than investing all available capital when the index reaches extreme fear, sophisticated traders scale into positions gradually, recognizing that sentiment can remain extreme longer than expected. Similarly, profit-taking during extreme greed periods should be systematic rather than all-or-nothing, allowing investors to capture gains while maintaining exposure to potential continued upside.

Divergence Analysis offers a more nuanced approach to sentiment-based trading, focusing on discrepancies between index readings and actual price movements. This strategy looks for situations where sentiment and price action tell different stories, potentially indicating underlying strength or weakness not reflected in current market psychology. For example, if the Fear and Greed Index shows extreme fear while Bitcoin’s price remains relatively stable or even increases, this divergence might suggest underlying buying pressure that could drive future price appreciation.

Divergence analysis requires careful attention to the relationship between sentiment and price action over time. Positive divergences occur when sentiment improves faster than prices, potentially indicating that a rally is building momentum. Negative divergences happen when sentiment deteriorates while prices remain elevated, possibly signaling that a correction is approaching. These patterns can provide early warning signals for major market moves.

The effectiveness of divergence analysis depends on understanding the typical lag between sentiment shifts and price movements. In some cases, sentiment changes precede price movements by days or weeks, while in others, price action leads sentiment changes. Experienced traders learn to recognize these patterns and adjust their strategies accordingly, using divergence analysis as a timing tool rather than a directional indicator.

Trend Confirmation Strategies use the Fear and Greed Index to validate signals from other technical or fundamental analysis tools. Rather than relying solely on sentiment readings, this approach combines index data with traditional indicators like moving averages, support and resistance levels, or fundamental metrics. When multiple indicators align with sentiment readings, it increases confidence in trading decisions and can lead to more successful outcomes.

For example, a trader might wait for both a technical breakout above key resistance and a shift from fear to neutral sentiment before entering a long position. This multi-factor approach reduces the likelihood of false signals and helps ensure that trades are supported by both technical and psychological factors. Similarly, the combination of negative technical signals and extreme greed readings might provide strong confirmation for short positions or profit-taking decisions.

Trend confirmation strategies work particularly well for traders who prefer higher-probability setups over frequent trading opportunities. By requiring alignment between sentiment and other factors, these strategies typically generate fewer signals but with higher success rates. This approach suits traders who prioritize capital preservation and prefer to wait for optimal entry and exit points rather than attempting to capture every market move.

Fear and Greed Index Chart

Dynamic Position Sizing represents an advanced application of sentiment analysis, where portfolio allocation adjusts based on current index readings. This strategy recognizes that risk-adjusted returns can be optimized by increasing exposure during periods of extreme fear and reducing exposure during periods of extreme greed. Rather than maintaining static position sizes, dynamic allocation allows investors to capitalize on sentiment-driven market inefficiencies.

The dynamic sizing approach typically involves establishing baseline portfolio allocations that adjust based on sentiment extremes. For example, an investor might maintain a 5% cryptocurrency allocation during neutral sentiment periods, increase to 10% during extreme fear, and reduce to 2% during extreme greed. These adjustments allow investors to increase exposure when assets are likely undervalued and reduce exposure when they may be overvalued.

Implementing dynamic position sizing requires careful planning and disciplined execution. Investors must establish clear rules for allocation adjustments and stick to them regardless of current market narratives or emotional impulses. The strategy also requires sufficient liquidity to make allocation changes without significant transaction costs or market impact.

Short-Term Momentum Trading uses rapid sentiment changes to identify short-term trading opportunities. This approach focuses on the speed of sentiment shifts rather than absolute readings, recognizing that rapid changes in market psychology often precede significant price movements. Traders using this strategy monitor the index for sudden shifts and position themselves to capitalize on the resulting price action.

Momentum trading based on sentiment requires quick decision-making and efficient execution capabilities. Traders must be prepared to act rapidly when sentiment shifts occur, as the most profitable opportunities often have short windows. This approach works best for experienced traders with access to advanced trading platforms and the ability to monitor markets continuously.

The key to successful momentum trading lies in distinguishing between genuine sentiment shifts and temporary noise. Experienced traders learn to recognize patterns in sentiment changes that typically precede significant price movements, allowing them to position themselves advantageously before the broader market reacts to changing psychology.

Risk Management and Limitations: Understanding the Boundaries

While the Fear and Greed Index provides valuable insights into market psychology, successful implementation requires understanding its limitations and incorporating appropriate risk management techniques. Like any analytical tool, the index is not infallible and should be used as part of a comprehensive trading and investment framework rather than as a standalone decision-making mechanism.

The Non-Predictive Nature of the index represents its most important limitation. The Fear and Greed Index measures current sentiment rather than predicting future price movements. While extreme sentiment readings often coincide with market turning points, the timing and magnitude of these turns cannot be precisely predicted using sentiment analysis alone. Markets can remain in extreme sentiment territory longer than expected, potentially causing significant losses for traders who assume immediate reversals.

This limitation requires traders to maintain realistic expectations about what sentiment analysis can and cannot accomplish. The index excels at identifying when markets may be psychologically stretched in one direction or another, but it cannot specify exactly when or how corrections will occur. Successful traders use sentiment readings to inform their decision-making process while relying on other tools for precise timing and risk management.

The non-predictive nature also means that sentiment-based strategies require patience and discipline. Contrarian positions taken during extreme sentiment periods may not immediately prove profitable, requiring traders to maintain positions through potentially adverse short-term price movements. This psychological challenge can be particularly difficult during extreme fear periods, when negative news continues to dominate headlines even after positions are established.

Market Correlation Risks present another significant limitation, particularly during periods of extreme market stress. While the Fear and Greed Index can help identify sentiment extremes, it cannot eliminate the correlation risks that characterize cryptocurrency markets during crisis periods. When broader financial markets experience significant stress, cryptocurrency assets tend to move together regardless of individual fundamentals or sentiment readings.

The correlation issue becomes particularly problematic during “risk-off” periods, when investors flee from all risky assets simultaneously. During such periods, even assets with strong fundamentals and attractive sentiment readings may experience significant declines as part of broader market liquidation. Traders must recognize that sentiment analysis works best during normal market conditions and may provide less reliable signals during systemic stress periods.

Understanding correlation risks requires monitoring broader financial market conditions alongside cryptocurrency-specific sentiment indicators. When traditional markets show signs of stress, cryptocurrency traders should adjust their expectations and risk management accordingly, recognizing that sentiment-based strategies may be less effective during periods of high correlation.

Data Quality and Manipulation Concerns represent ongoing challenges for sentiment-based analysis. The components of the Fear and Greed Index rely on various data sources, each with potential quality issues or manipulation risks. Social media sentiment, for example, can be artificially influenced through coordinated campaigns or bot activity. Similarly, survey responses may not always represent genuine trading intentions or may be biased toward particular outcomes.

The index creators employ various techniques to address data quality concerns, including filtering mechanisms for social media analysis and careful survey methodology design. However, traders should remain aware that no sentiment indicator is completely immune to manipulation or data quality issues. Diversifying across multiple sentiment indicators and combining sentiment analysis with other analytical approaches can help mitigate these risks.

Regular validation of sentiment signals against actual market behavior helps identify periods when data quality issues may be affecting index reliability. Experienced traders develop intuition for recognizing when sentiment readings seem disconnected from underlying market reality, allowing them to adjust their strategies accordingly.

Institutional vs. Retail Sentiment Divergence creates additional complexity in interpreting Fear and Greed Index readings. The index primarily captures retail investor sentiment through its various components, but institutional investor behavior may differ significantly from retail sentiment. During periods when institutional and retail sentiment diverge, the index may provide misleading signals about overall market direction.

This divergence can be particularly pronounced during major market transitions, when institutional investors may be accumulating positions while retail sentiment remains negative, or vice versa. Understanding the composition of market participants and their likely behavior patterns helps traders interpret sentiment readings more accurately and avoid potential pitfalls.

Monitoring institutional activity through on-chain analysis, exchange flows, and other indicators can provide complementary insights to retail-focused sentiment measures. Combining these different perspectives creates a more complete picture of market psychology and helps identify situations where sentiment-based strategies may be more or less effective.

Timing and Execution Challenges represent practical limitations that can significantly impact the effectiveness of sentiment-based strategies. Even when sentiment analysis correctly identifies market turning points, poor timing or execution can result in losses. The index updates every twelve hours, which may not provide sufficient granularity for short-term trading strategies, while longer-term strategies may require patience that many traders find difficult to maintain.

Successful implementation of sentiment-based strategies requires careful attention to execution details, including entry and exit timing, position sizing, and transaction costs. Traders must also consider market liquidity conditions, as sentiment extremes sometimes coincide with reduced liquidity that can make position establishment or liquidation more difficult and expensive.

Advanced Applications: Beyond Basic Sentiment Analysis

As cryptocurrency markets mature and institutional participation increases, sophisticated traders are developing advanced applications of Fear and Greed Index analysis that go beyond simple contrarian strategies. These advanced techniques combine sentiment analysis with other analytical frameworks to create more nuanced and potentially profitable trading approaches.

Multi-Timeframe Sentiment Analysis involves examining sentiment patterns across different time horizons to identify more robust trading opportunities. While the standard Fear and Greed Index provides daily readings, advanced traders construct their own sentiment indicators using different lookback periods and update frequencies. This approach helps distinguish between temporary sentiment fluctuations and more meaningful psychological shifts that are likely to drive sustained price movements.

The multi-timeframe approach typically involves analyzing short-term sentiment (daily readings), medium-term sentiment (weekly averages), and long-term sentiment (monthly trends). When sentiment readings align across multiple timeframes, it provides stronger conviction for trading decisions. Conversely, divergences between timeframes can signal potential turning points or highlight the need for additional caution.

Implementing multi-timeframe analysis requires careful data management and analytical capabilities. Traders must maintain historical sentiment data and develop systems for calculating rolling averages and identifying trend changes across different time horizons. This complexity makes the approach more suitable for sophisticated traders with advanced analytical tools and experience.

Sector-Specific Sentiment Analysis recognizes that different cryptocurrency sectors may experience varying sentiment patterns. While the standard Fear and Greed Index focuses primarily on Bitcoin and broad market sentiment, advanced traders develop specialized indicators for specific sectors like DeFi, NFTs, or layer-one protocols. This granular approach can identify opportunities in sectors that may be experiencing different psychological dynamics than the broader market.

Sector-specific analysis requires deep understanding of the unique factors that drive sentiment in different cryptocurrency niches. DeFi sentiment, for example, may be more influenced by regulatory developments and protocol innovations, while NFT sentiment might be more driven by cultural trends and celebrity endorsements. Developing effective sector-specific indicators requires specialized knowledge and data sources beyond those used in broad market analysis.

The sector approach can be particularly valuable during periods when cryptocurrency markets are experiencing rotation between different themes or sectors. By identifying sectors with improving sentiment while others deteriorate, traders can position themselves to benefit from these rotational dynamics rather than simply following broad market trends.

Sentiment Momentum Indicators focus on the rate of change in sentiment rather than absolute readings. These indicators recognize that rapid sentiment shifts often precede significant price movements, even when absolute sentiment levels remain within normal ranges. By measuring sentiment acceleration and deceleration, these indicators can provide earlier signals than traditional sentiment analysis approaches.

Momentum-based sentiment analysis typically involves calculating derivatives of sentiment readings, such as daily changes, weekly changes, and acceleration measures. When sentiment momentum reaches extreme levels, it often indicates that psychological conditions are building for significant market moves. This approach can be particularly effective for identifying turning points before they become apparent in absolute sentiment readings.

The momentum approach requires sophisticated mathematical analysis and careful parameter selection. Traders must determine appropriate lookback periods for momentum calculations and establish thresholds for identifying significant momentum shifts. The complexity of this analysis makes it more suitable for quantitative traders with strong mathematical backgrounds.

Cross-Asset Sentiment Correlation involves analyzing relationships between cryptocurrency sentiment and sentiment indicators from other asset classes. This approach recognizes that cryptocurrency markets do not exist in isolation and that broader financial market psychology can significantly influence crypto sentiment patterns. By understanding these relationships, traders can anticipate sentiment shifts in cryptocurrency markets based on developments in traditional finance.

Cross-asset analysis typically involves monitoring sentiment indicators for stocks, bonds, commodities, and currencies alongside cryptocurrency sentiment measures. During periods of high correlation, developments in traditional markets may provide leading indicators for cryptocurrency sentiment changes. Conversely, periods of low correlation may indicate that cryptocurrency markets are driven by crypto-specific factors rather than broader financial market psychology.

Implementing cross-asset sentiment analysis requires access to sentiment data from multiple markets and the analytical capability to identify meaningful relationships. This approach is most suitable for institutional traders or sophisticated individual investors with access to comprehensive market data and analytical tools.

The Future of Sentiment Analysis in Cryptocurrency Markets

As cryptocurrency markets continue to evolve and mature, sentiment analysis tools like the Fear and Greed Index are likely to become increasingly sophisticated and influential in trading decisions. Understanding the trajectory of these developments can help traders prepare for future opportunities and challenges in sentiment-based investing.

Artificial Intelligence and Machine Learning Integration represents one of the most promising areas for advancement in sentiment analysis. Current sentiment indicators rely primarily on relatively simple aggregation methods, but future versions are likely to incorporate advanced AI techniques that can identify more subtle patterns in market psychology. Machine learning algorithms could potentially identify sentiment patterns that human analysts miss, leading to more accurate and timely sentiment indicators.

AI-powered sentiment analysis could also address some current limitations, such as social media manipulation and data quality issues. Advanced algorithms could potentially distinguish between genuine sentiment expressions and artificial manipulation attempts, leading to more reliable sentiment readings. Natural language processing improvements could also enable more nuanced analysis of social media content, capturing subtle emotional nuances that current systems miss.

The integration of AI and machine learning will likely require significant computational resources and expertise, potentially creating advantages for institutional investors and sophisticated trading firms. However, as these technologies become more accessible, individual traders may also benefit from improved sentiment analysis tools that provide more accurate and actionable insights.

Real-Time Sentiment Processing represents another area of likely advancement, as current sentiment indicators typically update every twelve hours or daily. Future systems may provide real-time sentiment readings that update continuously as new data becomes available. This increased frequency could enable more responsive trading strategies and better timing of entry and exit decisions.

Real-time processing would be particularly valuable for short-term trading strategies that seek to capitalize on rapid sentiment shifts. However, it would also require careful filtering to distinguish between meaningful sentiment changes and temporary noise. The challenge will be developing systems that provide timely updates while maintaining the reliability and stability that make sentiment analysis useful for decision-making.

Institutional Sentiment Integration will likely become increasingly important as institutional participation in cryptocurrency markets continues to grow. Current sentiment indicators focus primarily on retail investor psychology, but future versions may need to incorporate institutional sentiment measures to provide complete market psychology pictures. This could involve analyzing institutional trading patterns, regulatory filings, and other data sources that reflect institutional investor attitudes.

The integration of institutional sentiment could significantly improve the predictive power of sentiment analysis, as institutional investors often have longer time horizons and different information sources than retail investors. Understanding when institutional and retail sentiment diverge could provide valuable insights into potential market turning points and help traders position themselves advantageously.

Regulatory Impact Assessment will become an increasingly important component of sentiment analysis as cryptocurrency regulation continues to develop globally. Future sentiment indicators may need to incorporate regulatory sentiment measures that assess how policy developments are likely to affect market psychology. This could involve analyzing regulatory announcements, policy proposals, and enforcement actions to gauge their potential impact on investor sentiment.

Regulatory sentiment analysis could help traders anticipate market reactions to policy developments and position themselves accordingly. As cryptocurrency markets become more sensitive to regulatory developments, understanding the sentiment implications of policy changes will become increasingly valuable for successful trading and investment strategies.

The evolution of sentiment analysis in cryptocurrency markets will likely create new opportunities for sophisticated traders while potentially reducing the effectiveness of simple sentiment-based strategies. As these tools become more widely available and understood, their predictive power may diminish, requiring traders to develop more advanced and nuanced approaches to sentiment-based investing.

Conclusion: Mastering the Psychology of Crypto Markets

The Cryptocurrency Fear and Greed Index represents far more than a simple market indicator—it serves as a window into the collective psychology that drives one of the world’s most dynamic and volatile financial markets. As we have explored throughout this comprehensive analysis, understanding and effectively utilizing sentiment analysis can provide significant advantages for traders and investors willing to master its complexities and limitations.

The current neutral reading of 47 offers a perfect case study in the practical application of sentiment analysis. This reading, representing a significant shift from the greed territory of just days ago, illustrates how quickly market psychology can change and how these changes can create both opportunities and risks for market participants. The transition from extreme optimism following Bitcoin’s new all-time high to more measured sentiment as prices corrected demonstrates the dynamic nature of cryptocurrency market psychology.

The six-component framework underlying the Fear and Greed Index provides a sophisticated approach to quantifying market sentiment that goes far beyond simple price-based indicators. By incorporating volatility analysis, volume patterns, social media sentiment, direct surveys, Bitcoin dominance, and search trends, the index captures multiple dimensions of market psychology that collectively provide insights into the emotional state of market participants. Understanding how these components interact and contribute to overall sentiment readings enables more nuanced interpretation of market conditions.

The trading strategies we have examined—from basic contrarian approaches to advanced multi-timeframe analysis—demonstrate the versatility of sentiment-based investing. Whether employed as a primary decision-making tool or as confirmation for other analytical approaches, sentiment analysis can enhance trading performance when properly implemented with appropriate risk management techniques. The key lies in understanding that sentiment analysis works best as part of a comprehensive analytical framework rather than as a standalone solution.

The limitations and risks associated with sentiment analysis underscore the importance of maintaining realistic expectations and implementing proper risk management techniques. The non-predictive nature of sentiment indicators, correlation risks during market stress, and potential data quality issues all require careful consideration when developing sentiment-based strategies. Successful practitioners learn to work within these limitations while maximizing the benefits that sentiment analysis can provide.

Looking toward the future, the evolution of sentiment analysis through artificial intelligence, real-time processing, and institutional integration promises to create new opportunities while potentially changing the effectiveness of current approaches. Traders who stay abreast of these developments and adapt their strategies accordingly will be best positioned to benefit from the continued evolution of sentiment analysis tools.

The current market environment, with its neutral sentiment reading and ongoing uncertainty about future direction, provides an excellent opportunity to apply the principles and strategies discussed in this analysis. Whether the market moves toward fear or greed territory in the coming days and weeks, understanding the psychological forces at work will help traders and investors make more informed decisions and potentially capitalize on the emotional extremes that characterize cryptocurrency markets.

Ultimately, mastering the Fear and Greed Index and sentiment analysis more broadly requires combining theoretical understanding with practical experience. The concepts and strategies outlined in this guide provide a foundation, but successful implementation requires practice, patience, and continuous learning. As cryptocurrency markets continue to evolve, those who understand the psychological forces driving market behavior will maintain significant advantages over those who focus solely on technical or fundamental analysis.

The Fear and Greed Index serves as a powerful reminder that behind every price movement, every market trend, and every trading opportunity lies human psychology in all its complexity. By learning to read and interpret these psychological signals, traders and investors can better navigate the challenging but potentially rewarding world of cryptocurrency markets, turning the emotional volatility that characterizes these markets from a source of risk into a source of opportunity.


References

[1] CoinStats. “Crypto Fear & Greed Index.” CoinStats, August 25, 2025. https://coinstats.app/fear-and-greed/

[2] TokenMetrics. “Crypto Fear and Greed Index – What it is and How to Use it?” TokenMetrics Blog, August 22, 2025. https://www.tokenmetrics.com/blog/crypto-fear-and-greed-index

[3] Alternative.me. “Crypto Fear & Greed Index – Bitcoin Sentiment.” Alternative.me, August 25, 2025. https://alternative.me/crypto/fear-and-greed-index/

[4] ChainCatcher. “Data: The current cryptocurrency fear and greed index is 46.” ChainCatcher, August 25, 2025. https://www.chaincatcher.com/en/article/2200237

What’s Coming Next for BTC — Breakdown or Bounce? A Critical Analysis of Bitcoin’s $113K Crossroads

Published by everythingcryptoitclouds.com | August 21, 2025

Bitcoin stands at one of its most critical junctures in 2025, trading around $113,800 after a notable correction from its recent all-time high of $124,533. As the world’s leading cryptocurrency consolidates within a narrow range, traders and investors are asking the same pressing question: will Bitcoin break down from current levels or stage a powerful bounce toward new highs? The answer to this question could determine the trajectory of the entire cryptocurrency market for the remainder of 2025.

The current market structure presents a fascinating case study in technical analysis, institutional adoption, and market psychology. After reaching unprecedented heights earlier this month, Bitcoin has entered a consolidation phase that has left both bulls and bears positioning for what could be the next major directional move. With $150 billion in Bitcoin ETF assets providing institutional support and the 2024 halving continuing to constrain supply, the fundamental backdrop remains robust. However, technical indicators are painting a more nuanced picture that demands careful analysis.

Bitcoin Price Analysis

The stakes couldn’t be higher. A successful bounce from current levels could propel Bitcoin toward the $120,000-$125,000 zone and potentially establish new all-time highs before year-end. Conversely, a breakdown below key support levels could trigger a more significant correction that tests the resolve of both institutional and retail investors. Understanding the technical, fundamental, and sentiment factors at play is crucial for anyone seeking to navigate this critical period in Bitcoin’s evolution.

The Technical Landscape: Mapping Bitcoin’s Critical Levels

Bitcoin’s current price action is defined by a series of well-established technical levels that have emerged through months of trading activity and institutional accumulation. The $113,000 zone where Bitcoin currently trades represents more than just a price level—it’s a battleground where the forces of supply and demand are engaged in a high-stakes contest that will determine the cryptocurrency’s near-term direction.

The most critical support level lies at $112,000, a threshold that has repeatedly attracted buying interest during recent corrections. This level has transformed from resistance to support following Bitcoin’s breakthrough earlier in the year, demonstrating the classic technical principle of role reversal. The strength of this support has been tested multiple times, with each successful defense reinforcing its significance in the minds of market participants. A sustained break below $112,000 would represent a significant technical failure that could trigger algorithmic selling and force leveraged positions to liquidate.

Below the immediate $112,000 support, a series of deeper support levels provide potential landing zones for any corrective move. The $110,000-$111,900 zone represents the next major support cluster, aligning with previous resistance levels and key Fibonacci retracement levels from Bitcoin’s recent advance. This area has historical significance as a accumulation zone where institutional buyers have previously stepped in during market weakness.

Should Bitcoin break below the $110,000 threshold, the next major support levels emerge at $107,400 and $105,200. These levels correspond to significant technical markers including the 200-day exponential moving average and major Fibonacci retracement levels. The psychological $100,000 level looms as the ultimate support test, representing not just a round number but a critical threshold that has captured the imagination of both institutional and retail investors.

On the upside, Bitcoin faces a series of resistance levels that could cap any rally attempt. The immediate resistance zone spans $114,000 to $115,000, representing the area where Bitcoin has struggled to maintain momentum during recent bounce attempts. This zone aligns with the 50-day simple moving average, which has been acting as dynamic resistance during the current consolidation phase.

The $117,500 level has emerged as a critical intermediate target for any bullish breakout. While not a direct Fibonacci extension, this level has shown significant importance in recent price action and represents a logical target for traders positioning for a bounce scenario. A successful break above $117,500 would likely trigger momentum-based buying and could accelerate Bitcoin’s advance toward higher targets.

The major resistance zone spans $120,000 to $123,000, encompassing the 0.768 Fibonacci extension of Bitcoin’s current bull cycle and representing the gateway to new all-time highs. This area has acted as a magnet for price action, with multiple attempts to break through resulting in rejection and subsequent consolidation. The volume and conviction required to break through this zone would likely signal the beginning of a new leg higher in Bitcoin’s bull market.

Institutional Dynamics: The New Market Structure

The landscape of Bitcoin trading has been fundamentally transformed by institutional adoption, creating a market structure that differs significantly from previous cycles. With over $150 billion in Bitcoin ETF assets and companies like MicroStrategy holding more than 629,000 BTC, institutional participation has introduced new dynamics that influence both support and resistance levels [1].

The presence of institutional investors has created what many analysts describe as a “floor” under Bitcoin prices, with large-scale accumulation occurring during any significant weakness. This institutional support has been evident during recent corrections, where buying interest has emerged consistently around key technical levels. The ETF structure allows traditional investors to gain Bitcoin exposure through familiar investment vehicles, creating a steady stream of demand that wasn’t present in previous market cycles.

However, institutional participation is a double-edged sword. While it provides support during corrections, it also introduces new sources of volatility when institutional flows reverse. Recent data shows moderate ETF outflows, reflecting some profit-taking by institutional investors following Bitcoin’s advance to all-time highs. These flows are closely monitored by market participants as they can provide early signals of changing institutional sentiment.

The derivatives market provides additional insight into institutional positioning and sentiment. Open interest in Bitcoin futures has been declining, indicating reduced speculative positioning and potentially setting the stage for a more sustainable move in either direction. The funding rate remains elevated and positive, confirming a bullish bias among leveraged traders, but this premium may actually hinder demand for new long positions as the cost of carrying leveraged exposure increases.

Wall Street’s involvement in Bitcoin has also introduced new trading patterns and volatility characteristics. The concentration of trading volume during New York market hours has become more pronounced, with significant price movements often coinciding with the opening and closing of traditional financial markets. This synchronization with traditional finance creates both opportunities and risks, as Bitcoin becomes more susceptible to broader market sentiment and macroeconomic developments.

The institutional adoption story extends beyond direct Bitcoin holdings to encompass the broader cryptocurrency ecosystem. The success of Bitcoin ETFs has paved the way for additional cryptocurrency investment products, creating a positive feedback loop that could drive further institutional adoption. However, this integration also means that Bitcoin is increasingly subject to the same regulatory and compliance considerations that govern traditional financial markets.

Market Sentiment and Psychology: Reading Between the Lines

Understanding market sentiment is crucial for predicting Bitcoin’s next move, as psychological factors often drive short-term price action even when fundamental and technical factors suggest a different direction. The current sentiment landscape presents a complex picture that reflects both the maturation of the cryptocurrency market and the ongoing tension between fear and greed that characterizes all financial markets.

The Fear and Greed Index, a widely followed sentiment indicator, currently shows a reading of “Fear,” representing a significant shift from the euphoric conditions that prevailed during Bitcoin’s advance to all-time highs. This shift in sentiment often precedes major market moves, as extreme readings in either direction tend to mark turning points in market psychology. The current fear reading suggests that negative sentiment may be reaching levels where contrarian investors begin to see value.

Technical Analysis Charts

Social media sentiment and on-chain metrics provide additional insight into market psychology. The decline in social media mentions and engagement around Bitcoin suggests that retail interest has cooled following the recent correction. This reduction in retail participation often creates conditions for more sustainable price movements, as the absence of speculative excess allows fundamental factors to play a larger role in price discovery.

The behavior of long-term holders provides another window into market sentiment. On-chain analysis shows that long-term holders have been relatively stable during the recent correction, suggesting that the selling pressure has come primarily from shorter-term traders and speculators. This pattern is generally viewed as healthy for long-term price appreciation, as it represents a transfer of Bitcoin from weak hands to strong hands.

Institutional sentiment, while more difficult to measure directly, can be inferred from ETF flows and corporate treasury decisions. The recent moderate outflows from Bitcoin ETFs suggest some institutional profit-taking, but the scale of these outflows remains relatively modest compared to the overall institutional holdings. This pattern suggests that institutional investors are engaging in tactical rebalancing rather than wholesale abandonment of their Bitcoin positions.

The options market provides additional insight into sentiment and expectations. The put-call ratio and implied volatility levels suggest that investors are positioning for increased volatility in the near term, but the distribution of strikes indicates that most participants expect Bitcoin to remain within a relatively narrow range. This positioning could create conditions for a significant move in either direction if Bitcoin breaks out of its current consolidation range.

The Bullish Case: Factors Supporting a Bounce

The argument for a Bitcoin bounce from current levels rests on a combination of technical, fundamental, and structural factors that suggest the recent correction may represent a healthy consolidation rather than the beginning of a more significant decline. Understanding these bullish factors is essential for evaluating the probability of a successful bounce and the potential targets for any resulting rally.

From a technical perspective, Bitcoin’s ability to hold above the critical $112,000 support level demonstrates the underlying strength of the current bull market. This level has been tested multiple times during the recent consolidation, with each successful defense reinforcing its significance as a floor for Bitcoin prices. The fact that Bitcoin has not experienced a significant breakdown despite weeks of consolidation suggests that selling pressure is being absorbed by willing buyers at these levels.

The moving average structure remains supportive of higher prices, with the 50-day and 200-day moving averages both trending higher and providing dynamic support during any weakness. The 50-day simple moving average, currently around $113,500, has been acting as a key reference point for traders and could serve as a launching pad for any bounce attempt. A sustained close above this level would likely trigger momentum-based buying from technical traders and algorithmic systems.

Volume analysis provides additional support for the bullish case. Despite the recent correction, weekly trading volumes have increased by 34% to $48 billion, indicating renewed market engagement rather than capitulation. This increase in volume during a consolidation phase often precedes significant directional moves, as it suggests that market participants are actively positioning for the next leg of the trend.

The fundamental backdrop for Bitcoin remains exceptionally strong, with the 2024 halving continuing to constrain new supply while institutional demand shows no signs of abating. The reduction in daily Bitcoin issuance to just 900 BTC has created a supply-demand imbalance that should theoretically support higher prices over time. This supply constraint becomes more significant as institutional adoption continues to grow and more Bitcoin is removed from active trading through long-term holding strategies.

Macroeconomic factors also support the bullish case for Bitcoin. The ongoing concerns about inflation, currency debasement, and geopolitical instability continue to drive interest in alternative stores of value. Bitcoin’s performance relative to traditional assets during periods of economic uncertainty has established its credentials as a hedge against systemic risks, attracting both institutional and retail investors seeking portfolio diversification.

The regulatory environment, while still evolving, has become increasingly favorable for Bitcoin adoption. The approval and success of Bitcoin ETFs has provided regulatory clarity and legitimacy that was previously lacking. This regulatory progress has opened the door for additional institutional participation and has reduced the regulatory overhang that previously weighed on Bitcoin prices.

Technical indicators also support the bullish case, with the Relative Strength Index (RSI) currently in the mid-60s, indicating room for further upside without reaching overbought conditions. The Average Directional Index (ADX) reading of 18.81 suggests weak directional momentum, but this often precedes sharp moves in either direction as market participants position for a breakout.

The Bearish Case: Warning Signs of a Breakdown

While the bullish case for Bitcoin presents compelling arguments, a thorough analysis must also consider the factors that could lead to a breakdown from current levels. Understanding these bearish risks is crucial for developing a balanced perspective on Bitcoin’s near-term prospects and for implementing appropriate risk management strategies.

The most immediate concern for Bitcoin bulls is the failure to reclaim and hold above key resistance levels despite multiple attempts. The repeated rejections at the $115,000-$117,500 zone suggest that selling pressure remains significant at these levels, potentially indicating that institutional or large-scale holders are using rallies as opportunities to reduce their positions. This distribution pattern, if confirmed, could lead to a more significant correction as the supply overhang weighs on prices.

Technical momentum indicators are showing signs of deterioration that could precede a breakdown. While the RSI remains in neutral territory, the failure to generate positive divergence during recent bounce attempts suggests that buying interest may be waning. The declining open interest in Bitcoin futures markets indicates reduced speculative positioning, which could limit the fuel available for a sustained rally.

The broader cryptocurrency market context also presents bearish risks for Bitcoin. The recent underperformance of altcoins relative to Bitcoin suggests that risk appetite in the cryptocurrency space may be diminishing. Historically, periods of altcoin weakness have often preceded broader cryptocurrency market corrections, as they indicate a flight to quality that eventually encompasses even Bitcoin.

Macroeconomic headwinds pose additional risks to Bitcoin’s near-term prospects. The Federal Reserve’s monetary policy outlook remains uncertain, with markets pricing in potential changes to interest rate policy that could affect risk asset valuations. Bitcoin’s correlation with traditional risk assets has increased during periods of market stress, making it vulnerable to broader market selloffs driven by macroeconomic concerns.

Bitcoin Market Trends

The institutional flow data presents a mixed picture that could turn more negative if current trends continue. While ETF outflows have been moderate, any acceleration in institutional selling could create significant downward pressure on Bitcoin prices. The concentration of Bitcoin holdings among a relatively small number of institutional players means that changes in their positioning can have outsized impacts on market dynamics.

Sentiment indicators, while not at extreme levels, show a clear deterioration from the euphoric conditions that prevailed during Bitcoin’s advance to all-time highs. The shift in the Fear and Greed Index to “Fear” territory suggests that market psychology is becoming more negative, potentially setting the stage for further selling if technical support levels fail.

The derivatives market structure also presents bearish risks. The high funding rates in perpetual futures markets indicate that leveraged long positions are paying a significant premium to maintain their exposure. This situation creates conditions for potential liquidation cascades if Bitcoin breaks below key support levels, as leveraged positions are forced to close and add to selling pressure.

On-chain metrics provide additional warning signs that could precede a breakdown. While long-term holders have remained relatively stable, there are signs of increased activity among shorter-term holders that could indicate preparation for selling. The exchange inflow data shows periodic spikes that suggest some holders are moving Bitcoin to exchanges in preparation for potential sales.

Critical Scenarios: Mapping the Paths Forward

Understanding the specific scenarios that could unfold from Bitcoin’s current position is essential for traders and investors seeking to position themselves for the next major move. The technical setup presents two primary scenarios, each with distinct triggers, targets, and implications for the broader cryptocurrency market.

The bullish scenario hinges on Bitcoin’s ability to reclaim and hold above the $113,500 level, which aligns with the 50-day simple moving average and represents a critical technical threshold. A sustained close above this level would likely trigger momentum-based buying from both technical traders and algorithmic systems, potentially accelerating Bitcoin’s advance toward higher targets. The initial target in this scenario would be the $117,500 level, representing approximately a 3-4% gain from current levels.

A successful break above $117,500 would open the door to a test of the major resistance zone between $120,000 and $123,000. This area encompasses the 0.768 Fibonacci extension of Bitcoin’s current bull cycle and represents the gateway to new all-time highs. A break above this zone could trigger a momentum-driven advance toward the $127,000-$132,000 area, representing potential gains of 15-17% from current levels.

The bullish scenario would likely be accompanied by increasing trading volumes and improving sentiment indicators. The Fear and Greed Index would likely shift back toward “Greed” territory, while social media engagement and retail interest would probably increase. Institutional flows would need to turn positive to support a sustained rally, with ETF inflows providing the fuel for higher prices.

The bearish scenario begins with a break below the critical $112,000 support level, which would represent a significant technical failure and likely trigger algorithmic selling. The initial target in this scenario would be the $110,000-$111,900 support zone, representing a 2-3% decline from current levels. However, the real risk in the bearish scenario lies in the potential for a cascade of selling that could drive Bitcoin toward much lower levels.

A break below $110,000 would likely accelerate the decline toward the $107,400 and $105,200 support levels, representing potential losses of 6-8% from current levels. The ultimate downside target in the bearish scenario would be the psychological $100,000 level, which could be reached if selling pressure intensifies and leveraged positions are forced to liquidate.

The bearish scenario would likely be characterized by increasing volatility and deteriorating sentiment indicators. The Fear and Greed Index would probably shift toward “Extreme Fear” territory, while institutional flows would turn negative as ETFs experience sustained outflows. The broader cryptocurrency market would likely follow Bitcoin lower, with altcoins experiencing even more significant declines.

Both scenarios have specific risk management implications that traders and investors must consider. In the bullish scenario, stop-loss levels should be placed below the $112,000 support to limit downside risk, while position sizing should account for Bitcoin’s inherent volatility. In the bearish scenario, any long positions should be protected with tight stops, while short-term traders might consider waiting for a clearer directional signal before establishing new positions.

Expert Analysis and Market Commentary

The current Bitcoin market structure has attracted significant attention from technical analysts, institutional strategists, and cryptocurrency experts, each offering unique perspectives on the potential outcomes of the current consolidation phase. Understanding these expert viewpoints provides valuable context for evaluating the competing scenarios and their relative probabilities.

Christopher Lewis, a veteran forex and cryptocurrency analyst with over 20 years of experience in financial markets, maintains a constructive view on Bitcoin’s near-term prospects. In his recent analysis, Lewis emphasized the importance of the $112,000 support level, noting that “Bitcoin bounced quite nicely during the trading session on Wednesday, as we have seen the $112,000 level reassert itself at an important level” [2]. His analysis suggests that as long as Bitcoin can maintain this support, the path of least resistance remains higher, with the $120,000 level serving as a “magnet for price.”

Lewis’s perspective is particularly noteworthy given his emphasis on the role of institutional participation in Bitcoin’s current market structure. He notes that “Wall Street is heavily involved in bitcoin now, so it will pay close attention to the volume coming out of New York.” This observation highlights the importance of monitoring institutional flows and trading patterns during New York market hours, as these have become increasingly influential in determining Bitcoin’s direction.

The technical analysis team at BlockByte, a prominent cryptocurrency research firm, has characterized the current setup as a “strategic breakout play” with well-defined risk-reward parameters. Their analysis identifies the $113,000 zone as a “pivotal battleground for bulls and bears,” with the potential for either a bullish breakout toward $117,500 or a bearish breakdown toward $100,000. This binary outlook reflects the compressed nature of Bitcoin’s current trading range and the potential for significant moves in either direction.

BlockByte’s analysis emphasizes the importance of risk management in the current environment, recommending strategic entry points in the $112,000-$113,000 range with stop-loss levels below $110,000. Their approach reflects the high-probability nature of the current setup while acknowledging the significant risks associated with Bitcoin’s volatility.

The technical analysis team at CoinTribune provides a more nuanced perspective that acknowledges both the underlying strength of Bitcoin’s long-term trend and the short-term challenges facing the cryptocurrency. Their analysis notes that “Bitcoin is trading in a consolidation phase, where the strength of the underlying trend contrasts with short-term fragilities.” This observation captures the tension between Bitcoin’s strong fundamental backdrop and the technical challenges it faces in the near term.

CoinTribune’s analysis places particular emphasis on the role of macroeconomic factors in determining Bitcoin’s next move. They note that “reactions to key technical thresholds and the macroeconomic climate will be decisive, especially as markets remain shaken by the notion that the Fed might not cut rates in September.” This perspective highlights the increasing correlation between Bitcoin and traditional financial markets, particularly during periods of macroeconomic uncertainty.

Institutional analysts have also weighed in on Bitcoin’s current situation, with many emphasizing the importance of ETF flows and corporate treasury decisions. The moderate outflows from Bitcoin ETFs in recent weeks have been interpreted by some analysts as healthy profit-taking rather than a fundamental shift in institutional sentiment. However, the sustainability of institutional demand remains a key factor that could determine Bitcoin’s ability to break out of its current range.

Risk Management and Strategic Considerations

Navigating Bitcoin’s current market environment requires a sophisticated approach to risk management that accounts for the cryptocurrency’s inherent volatility, the binary nature of the current setup, and the potential for significant moves in either direction. Developing an appropriate risk management framework is essential for both preserving capital and positioning for potential opportunities.

The first principle of risk management in the current environment is position sizing. Given Bitcoin’s volatility and the potential for significant moves in either direction, investors should limit their exposure to levels that allow them to withstand adverse price movements without compromising their overall portfolio objectives. A common rule of thumb suggests limiting cryptocurrency exposure to no more than 5-10% of a total investment portfolio, though this percentage may vary based on individual risk tolerance and investment objectives.

Stop-loss placement represents another critical component of risk management in the current environment. For investors maintaining long positions, stop-loss levels should be placed below the $110,000 support zone to limit downside risk while allowing for normal market volatility. This placement provides a buffer against false breakdowns while protecting against more significant losses if Bitcoin’s support structure fails.

The timing of entries and exits becomes particularly important in the current environment, where Bitcoin is trading within a relatively narrow range with well-defined support and resistance levels. Investors seeking to establish new long positions might consider waiting for a successful test and hold of the $112,000 support level, while those looking to reduce exposure might use rallies toward the $115,000-$117,500 resistance zone as opportunities to take profits.

Diversification within the cryptocurrency space also requires careful consideration in the current environment. While Bitcoin’s dominance has increased during the recent consolidation phase, the performance of altcoins and the broader cryptocurrency market could provide important signals about the sustainability of any Bitcoin rally. Investors should monitor the relative performance of major altcoins and cryptocurrency market indices as leading indicators of broader market sentiment.

The role of leverage in the current environment deserves special attention, as the potential for significant moves in either direction creates both opportunities and risks for leveraged positions. The high funding rates in perpetual futures markets indicate that leveraged long positions are expensive to maintain, while the potential for liquidation cascades creates additional risks for highly leveraged traders.

Hedging strategies may be appropriate for investors with significant Bitcoin exposure who want to maintain their long-term positions while protecting against near-term volatility. Options strategies, including protective puts or collar strategies, can provide downside protection while allowing for participation in any upside moves. However, the cost of options protection should be weighed against the potential benefits, particularly in a high-volatility environment.

Conclusion: Preparing for Bitcoin’s Next Chapter

As Bitcoin consolidates around the critical $113,000 level, the cryptocurrency market finds itself at a pivotal moment that could determine the trajectory of digital assets for the remainder of 2025. The technical setup presents a classic high-probability scenario with well-defined risk-reward parameters, clear support and resistance levels, and the potential for significant moves in either direction.

The bullish case for Bitcoin remains compelling, supported by strong institutional adoption, supply constraints from the 2024 halving, and a technical structure that suggests the recent correction may represent a healthy consolidation rather than the beginning of a more significant decline. The ability of Bitcoin to hold above the $112,000 support level despite weeks of consolidation demonstrates the underlying strength of the current bull market and suggests that selling pressure is being absorbed by willing buyers.

However, the bearish risks cannot be ignored, particularly given the repeated failures to break above key resistance levels and the deteriorating momentum indicators. The shift in market sentiment from euphoria to fear, combined with moderate institutional outflows and elevated funding rates, creates conditions where a breakdown below support could trigger a more significant correction.

The path forward for Bitcoin will likely be determined by its ability to navigate the critical technical levels that define the current trading range. A successful bounce from current levels that reclaims the $115,000-$117,500 resistance zone could open the door to new all-time highs and a continuation of the current bull market. Conversely, a breakdown below the $112,000 support level could trigger a correction toward the $100,000 psychological threshold and potentially delay Bitcoin’s advance to higher levels.

For investors and traders, the current environment demands a disciplined approach that emphasizes risk management, appropriate position sizing, and clear entry and exit strategies. The binary nature of the current setup creates both opportunities and risks that require careful navigation and a thorough understanding of the factors that could influence Bitcoin’s next move.

As we look ahead, the interplay between technical factors, institutional flows, and macroeconomic developments will likely determine whether Bitcoin breaks down or bounces from current levels. The outcome of this critical juncture will not only affect Bitcoin’s price trajectory but could also influence the broader cryptocurrency market and the pace of digital asset adoption.

The question of whether Bitcoin will experience a breakdown or bounce from current levels remains unanswered, but the framework for understanding the potential outcomes is clear. By monitoring the key technical levels, institutional flows, and sentiment indicators discussed in this analysis, market participants can position themselves to navigate whatever scenario ultimately unfolds.

Bitcoin’s journey to this critical juncture reflects the maturation of the cryptocurrency market and the increasing influence of institutional participants. As the market continues to evolve, the lessons learned from navigating this pivotal moment will likely inform investment strategies and risk management approaches for years to come.


References

[1] AInvest. “Bitcoin’s Critical Support and Resistance: A Strategic Breakout Play at $113K.” AInvest, August 21, 2025. https://www.ainvest.com/news/bitcoin-critical-support-resistance-strategic-breakout-play-113k-2508/

[2] Daily Forex. “BTC/USD Forecast: Support Holds at $112K.” Daily Forex, August 21, 2025. https://www.dailyforex.com/forex-technical-analysis/2025/08/btcusd-forecast-21-august-2025/232942

The Perfect Storm: How $53 Billion in Crypto Leverage and Cloud Computing’s $2.2 Trillion Boom Are Reshaping Digital Finance

Published by everythingcryptoitclouds.com | August 15, 2025

The digital finance landscape is experiencing a seismic shift that few saw coming. As Bitcoin touches new record highs above $124,000 and the global cloud computing market races toward a staggering $2.2 trillion valuation by 2030, we’re witnessing the convergence of two technological revolutions that are fundamentally reshaping how we think about money, data, and digital infrastructure.

The numbers tell a compelling story. Crypto-collateralized lending has exploded to an all-time high of $53.09 billion in Q2 2025, representing a massive 27.44% quarter-over-quarter growth [1]. Meanwhile, the cloud computing sector continues its relentless expansion, growing at a compound annual growth rate of 16.6% and projected to surge from $781.27 billion in 2025 to $911 billion in 2026 [2]. But these aren’t just isolated trends—they’re interconnected forces that are creating unprecedented opportunities and challenges in the digital economy.

Blockchain Technology Infrastructure

The Crypto Leverage Revolution: $53 Billion and Counting

The cryptocurrency lending market has reached a critical inflection point that demands our attention. According to Galaxy Research’s comprehensive Q2 2025 analysis, the total crypto-collateralized lending market has expanded to $53.09 billion, with DeFi applications alone accounting for $26.47 billion—a staggering 42.11% increase from the previous quarter [1].

This explosive growth isn’t happening in a vacuum. The surge in crypto leverage is being driven by three fundamental forces that are reshaping the entire digital asset ecosystem. First, we’re seeing a reflexivity effect where rising asset prices fuel increased borrowing activity, creating a self-reinforcing cycle of growth. As Bitcoin and other major cryptocurrencies reach new highs, investors are increasingly willing to use their digital assets as collateral to access additional capital.

Second, increased competition among lending platforms is driving down borrowing costs while improving service quality. This competitive dynamic has created more attractive rates and better scalability, making crypto-backed lending accessible to a broader range of investors. The market is no longer dominated by a few players—instead, we’re seeing a diverse ecosystem of both centralized finance (CeFi) and decentralized finance (DeFi) platforms competing for market share.

Third, and perhaps most significantly, digital asset treasury companies (DATCOs) have emerged as a major new source of demand. These entities, which hold cryptocurrencies as part of their corporate treasury strategies, are increasingly turning to CeFi lenders to finance their operations and expansion plans. This institutional adoption represents a fundamental shift in how businesses view cryptocurrency—not just as a speculative asset, but as a legitimate form of corporate treasury management.

The market concentration tells its own story about the maturation of this sector. Tether dominates the CeFi lending space with $10.14 billion in outstanding loans, commanding a 57.02% market share. Nexo follows with $1.96 billion (11.01% market share), while Galaxy holds $1.11 billion (6.23% market share). Together, these top three players control 74.26% of the tracked CeFi lending market [1].

But perhaps the most remarkable aspect of this growth is its resilience. The crypto lending market has grown by $10.59 billion (+147.5%) since the bear market trough of $7.18 billion in Q4 2023. This recovery demonstrates not just the cyclical nature of crypto markets, but the underlying structural demand for crypto-backed financial services.

September’s Altcoin Season: The $2 Trillion Rotation Begins

As we move into September, market analysts are predicting the beginning of what could be the most significant altcoin season in years. Coinbase Institutional’s latest research identifies three key drivers that could shift market leadership from Bitcoin to alternative cryptocurrencies, potentially triggering a massive capital rotation worth trillions of dollars [3].

The first driver is the softening of Bitcoin dominance. Bitcoin’s share of the total cryptocurrency market value has shown signs of weakening after peaking earlier this year. This isn’t just a temporary fluctuation—it represents a fundamental shift in how capital flows through the crypto ecosystem. Historically, as Bitcoin dominance declines, capital flows first into large-cap altcoins like Ethereum, Solana, and XRP, before eventually trickling down to mid-cap and small-cap tokens. This rotation effect creates opportunities for investors who can position themselves ahead of the trend.

The second factor is the dramatic improvement in liquidity conditions across major cryptocurrency exchanges. Traders are now seeing tighter bid-ask spreads and deeper order books, making it significantly easier to enter and exit altcoin positions without incurring heavy slippage. This improved liquidity is particularly important for institutional investors and larger players who might otherwise avoid less-traded tokens due to execution concerns.

The third and perhaps most crucial driver is the renewed appetite for risk among cryptocurrency investors. As macroeconomic conditions stabilize and market volatility remains contained, investors are increasingly willing to seek higher returns in riskier crypto assets. This environment is particularly conducive to sustained inflows into the altcoin market, especially if Bitcoin’s price consolidates rather than surging to new highs.

Data Center Infrastructure

The performance data already shows early signs of this rotation. While Bitcoin is up an impressive 27.2% year-to-date, several major altcoins are significantly outperforming. Ethereum has gained 37.9%, XRP has surged 49%, and even traditionally volatile assets like ADA have posted gains of 8.96% [3]. This outperformance suggests that the market is already beginning to price in the expected altcoin season.

Cloud Computing’s $2.2 Trillion Infrastructure Boom

While the cryptocurrency world captures headlines with its dramatic price movements and leverage growth, the cloud computing sector is quietly building the infrastructure that will support the next generation of digital finance. The numbers are staggering: the global cloud computing market is projected to reach $2.2 trillion by 2030, growing from its current base of $781.27 billion in 2025 [4].

This growth isn’t just about traditional enterprise applications moving to the cloud. We’re witnessing a fundamental transformation in how financial services, cryptocurrency platforms, and blockchain networks operate. The integration of artificial intelligence and machine learning with cloud infrastructure is unlocking new levels of efficiency and capability that were previously impossible.

The convergence of AI and cloud computing is particularly relevant for cryptocurrency platforms and DeFi protocols. These systems require massive computational resources to process transactions, maintain security, and provide real-time analytics to users. Cloud infrastructure provides the scalability and reliability needed to support the growing crypto ecosystem, while AI enhances everything from fraud detection to automated trading strategies.

Private cloud adoption is being driven by data sovereignty concerns, particularly relevant for cryptocurrency exchanges and financial institutions that must comply with varying regulatory requirements across different jurisdictions. The ability to maintain control over data location and access while still benefiting from cloud scalability has become a critical competitive advantage [5].

Edge computing and IoT integration represent another major trend that’s reshaping the cloud landscape. For cryptocurrency mining operations and blockchain networks, edge computing can reduce latency and improve efficiency by processing data closer to where it’s generated. This is particularly important for high-frequency trading applications and real-time blockchain analytics.

The Convergence: Where Crypto Meets Cloud

The intersection of cryptocurrency growth and cloud computing expansion is creating entirely new categories of business opportunities. Cryptocurrency mining operations are increasingly relying on cloud infrastructure to scale their operations efficiently. Cloud mining platforms have emerged as a major trend in 2025, offering investors exposure to cryptocurrency mining without the need to purchase and maintain expensive hardware [6].

The scalability benefits are obvious. Traditional cryptocurrency mining requires significant upfront capital investment in specialized hardware, ongoing maintenance costs, and access to cheap electricity. Cloud mining platforms abstract away these complexities, allowing investors to participate in mining operations through cloud-based contracts. This democratization of mining access is expanding the total addressable market for cryptocurrency mining beyond traditional tech-savvy investors.

But the convergence goes deeper than just mining. Cryptocurrency exchanges and DeFi platforms are leveraging cloud infrastructure to handle the massive transaction volumes and computational requirements of modern digital finance. The ability to scale computing resources up or down based on demand is crucial for platforms that experience significant volatility in user activity.

Altcoin Season Index

Data analytics and artificial intelligence are becoming increasingly important for cryptocurrency platforms. Cloud computing provides the computational power needed to analyze massive datasets, identify trading patterns, and provide real-time insights to users. This capability is particularly valuable for institutional investors who require sophisticated analytics tools to make informed investment decisions.

The security implications are equally significant. Cloud providers offer enterprise-grade security features that many cryptocurrency platforms couldn’t afford to implement independently. This includes advanced encryption, multi-factor authentication, and continuous monitoring for suspicious activity. As the cryptocurrency industry matures and attracts more institutional investment, these security features become increasingly important.

Market Implications and Investment Opportunities

The convergence of crypto leverage growth and cloud computing expansion is creating a new category of investment opportunities that savvy investors are beginning to recognize. The $53 billion crypto lending market represents just the beginning of what could become a much larger ecosystem of crypto-backed financial services.

For investors, the key is understanding how these trends reinforce each other. The growth in crypto lending creates demand for more sophisticated infrastructure, which drives cloud computing adoption. Meanwhile, improved cloud infrastructure enables more efficient and secure crypto platforms, which attracts more users and capital to the ecosystem.

The altcoin season predictions for September add another layer of complexity and opportunity. If Coinbase’s analysis proves correct, we could see a significant rotation of capital from Bitcoin into alternative cryptocurrencies. This rotation would likely benefit platforms and services that support a broad range of digital assets, rather than those focused exclusively on Bitcoin.

The timing is particularly interesting given the broader macroeconomic environment. With traditional interest rates remaining elevated and inflation concerns persisting, investors are increasingly looking for alternative sources of yield. Crypto-backed lending offers attractive returns, while cloud computing stocks provide exposure to one of the fastest-growing sectors in the technology industry.

Regulatory Considerations and Risk Management

As these markets continue to grow and converge, regulatory considerations become increasingly important. The crypto lending market, in particular, operates in a complex regulatory environment that varies significantly across different jurisdictions. Investors and platforms must navigate evolving regulations while building sustainable business models.

The integration of cloud computing with cryptocurrency operations also raises important questions about data sovereignty and regulatory compliance. Financial institutions and cryptocurrency platforms must ensure that their cloud infrastructure meets the regulatory requirements of all jurisdictions in which they operate.

Risk management becomes particularly crucial as leverage levels increase across the crypto ecosystem. The $53 billion in crypto-collateralized lending represents significant systemic risk if not properly managed. Platforms must implement robust risk management frameworks that can handle the volatility inherent in cryptocurrency markets.

Looking Ahead: The Future of Digital Finance Infrastructure

As we look toward the remainder of 2025 and beyond, the convergence of cryptocurrency growth and cloud computing expansion seems likely to accelerate. The infrastructure being built today will support the next generation of digital financial services, from decentralized autonomous organizations (DAOs) to programmable money and beyond.

The $2.2 trillion cloud computing market projection for 2030 suggests that we’re still in the early stages of this transformation. Similarly, the crypto lending market’s growth to $53 billion represents just a fraction of the total addressable market for crypto-backed financial services.

For businesses and investors, the key is positioning for this convergence rather than viewing these trends in isolation. The companies that successfully bridge the gap between traditional cloud computing and emerging cryptocurrency applications are likely to capture disproportionate value as these markets continue to grow and mature.

The September altcoin season predictions add urgency to these considerations. If we do see a significant rotation of capital into alternative cryptocurrencies, it could accelerate the adoption of more diverse crypto-backed financial services and drive additional demand for the cloud infrastructure needed to support them.

Conclusion: Riding the Wave of Digital Transformation

The convergence of $53 billion in crypto leverage and the $2.2 trillion cloud computing boom represents more than just impressive growth numbers—it signals a fundamental transformation in how we think about money, data, and digital infrastructure. As we move into September and the potential beginning of altcoin season, investors and businesses have an opportunity to position themselves at the forefront of this digital revolution.

The key is understanding that these aren’t separate trends but interconnected forces that are reshaping the entire landscape of digital finance. The companies and investors who recognize this convergence and position themselves accordingly are likely to benefit disproportionately as these markets continue to grow and mature.

Whether you’re an individual investor looking to diversify your portfolio, a business considering crypto treasury strategies, or a technology company building the infrastructure for tomorrow’s digital economy, the time to act is now. The perfect storm of crypto growth and cloud expansion is creating opportunities that may not come again for years.


References

[1] Galaxy Research. “The State of Crypto Leverage – Q2 2025.” Galaxy Digital, August 14, 2025. https://www.galaxy.com/insights/research/the-state-of-crypto-leverage-q2-2025

[2] Hostinger. “Top software development trends in 2025: AI, security, and what’s next.” Hostinger Tutorials, August 2025. https://www.hostinger.com/tutorials/software-development-trends

[3] CoinDesk. “3 Reasons Why Altcoins Are Likely to Outperform Starting in September: Coinbase Research.” CoinDesk Markets, August 15, 2025. https://www.coindesk.com/markets/2025/08/15/altcoin-season-could-begin-in-september-as-bitcoin-s-grip-on-crypto-market-coinbase-institutional

[4] Yahoo Finance. “Cloud Computing Market Surges to $2281.1 billion by 2030.” Yahoo Finance, August 2025. https://finance.yahoo.com/news/cloud-computing-market-surges-2-133000144.html

[5] Cloudian. “Private Cloud in 2025: Trends, Technologies, and Best Practices.” Cloudian Guides, August 2025. https://cloudian.com/guides/private-cloud/private-cloud-in-2025-trends-technologies-and-best-practices/

[6] Coin Central. “8 Major Cloud Mining Trends and Platform Reviews in 2025.” Coin Central, August 2025. https://coincentral.com/8-major-cloud-mining-trends-and-platform-reviews-in-2025-secure-and-profitable-new-options-for-cryptocurrency-mining-2/